arviz.plot_elpd#
- arviz.plot_elpd(compare_dict, color='C0', xlabels=False, figsize=None, textsize=None, coords=None, legend=False, threshold=None, ax=None, ic=None, scale=None, var_name=None, plot_kwargs=None, backend=None, backend_kwargs=None, show=None)[source]#
Plot pointwise elpd differences between two or more models.
Pointwise model comparison based on their expected log pointwise predictive density (ELPD).
- Parameters:
- compare_dict
mappingof {strELPDDataorInferenceData} A dictionary mapping the model name to the object containing inference data or the result of
arviz.loo()orarviz.waic()functions. Refer toarviz.convert_to_inference_data()for details on possible dict items.- color
stror array_like, default “C0” Colors of the scatter plot. If color is a str all dots will have the same color. If it is the size of the observations, each dot will have the specified color. Otherwise, it will be interpreted as a list of the dims to be used for the color code.
- xlabelsbool, default
False Use coords as xticklabels.
- figsize(
float,float), optional If
None, size is (8 + numvars, 8 + numvars).- textsize
float, optional Text size for labels. If
Noneit will be autoscaled based onfigsize.- coords
mapping, optional Coordinates of points to plot. All values are used for computation, but only a subset can be plotted for convenience. See this section for usage examples.
- legendbool, default
False Include a legend to the plot. Only taken into account when color argument is a dim name.
- threshold
float, optional If some elpd difference is larger than
threshold * elpd.std(), show its label. IfNone, no observations will be highlighted.- ic
str, optional Information Criterion (“loo” for PSIS-LOO, “waic” for WAIC) used to compare models. Defaults to
rcParams["stats.information_criterion"]. Only taken into account when input isarviz.InferenceData.- scale
str, optional Scale argument passed to
arviz.loo()orarviz.waic(), see their docs for details. Only taken into account when values incompare_dictarearviz.InferenceData.- var_name
str, optional Argument passed to to
arviz.loo()orarviz.waic(), see their docs for details. Only taken into account when values incompare_dictarearviz.InferenceData.- plot_kwargs
dicts, optional Additional keywords passed to
matplotlib.axes.Axes.scatter().- ax
axes, optional matplotlib.axes.Axesorbokeh.plotting.Figure.- backend{“matplotlib”, “bokeh”}, default “matplotlib”
Select plotting backend.
- backend_kwargs
dict, optional These are kwargs specific to the backend being used, passed to
matplotlib.pyplot.subplots()orbokeh.plotting.figure. For additional documentation check the plotting method of the backend.- showbool, optional
Call backend show function.
- compare_dict
- Returns:
- axes
matplotlib AxesorBokeh Figure
- axes
See also
plot_compareSummary plot for model comparison.
looCompute Pareto-smoothed importance sampling leave-one-out cross-validation (PSIS-LOO-CV).
waicCompute the widely applicable information criterion.
Notes
The ELPD is estimated either by Pareto smoothed importance sampling leave-one-out cross-validation (LOO) or using the widely applicable information criterion (WAIC). We recommend LOO in line with the work presented by [1].
References
[1]Vehtari et al. (2016). Practical Bayesian model evaluation using leave-one-out cross-validation and WAIC https://arxiv.org/abs/1507.04544
Examples
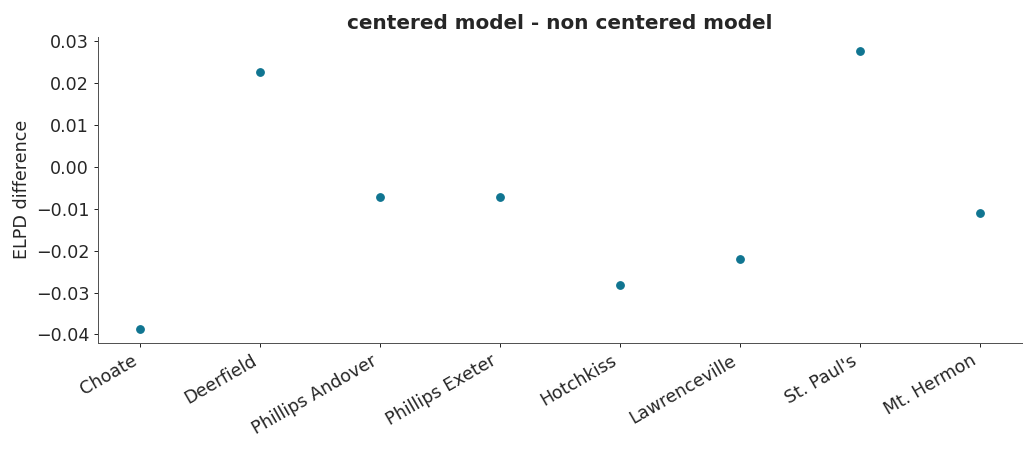
Compare pointwise PSIS-LOO for centered and non centered models of the 8-schools problem using matplotlib.
>>> import arviz as az
>>> idata1 = az.load_arviz_data("centered_eight")
>>> idata2 = az.load_arviz_data("non_centered_eight")
>>> az.plot_elpd(
>>>     {"centered model": idata1, "non centered model": idata2},
>>>     xlabels=True
>>> )
import arviz as az
idata1 = az.load_arviz_data("centered_eight")
idata2 = az.load_arviz_data("non_centered_eight")
az.plot_elpd(
    {"centered model": idata1, "non centered model": idata2},
    backend="bokeh"
)