arviz.plot_rank#
- arviz.plot_rank(data, var_names=None, filter_vars=None, transform=None, coords=None, bins=None, kind='bars', colors='cycle', ref_line=True, labels=True, labeller=None, grid=None, figsize=None, ax=None, backend=None, ref_line_kwargs=None, bar_kwargs=None, vlines_kwargs=None, marker_vlines_kwargs=None, backend_kwargs=None, show=None)[source]#
Plot rank order statistics of chains.
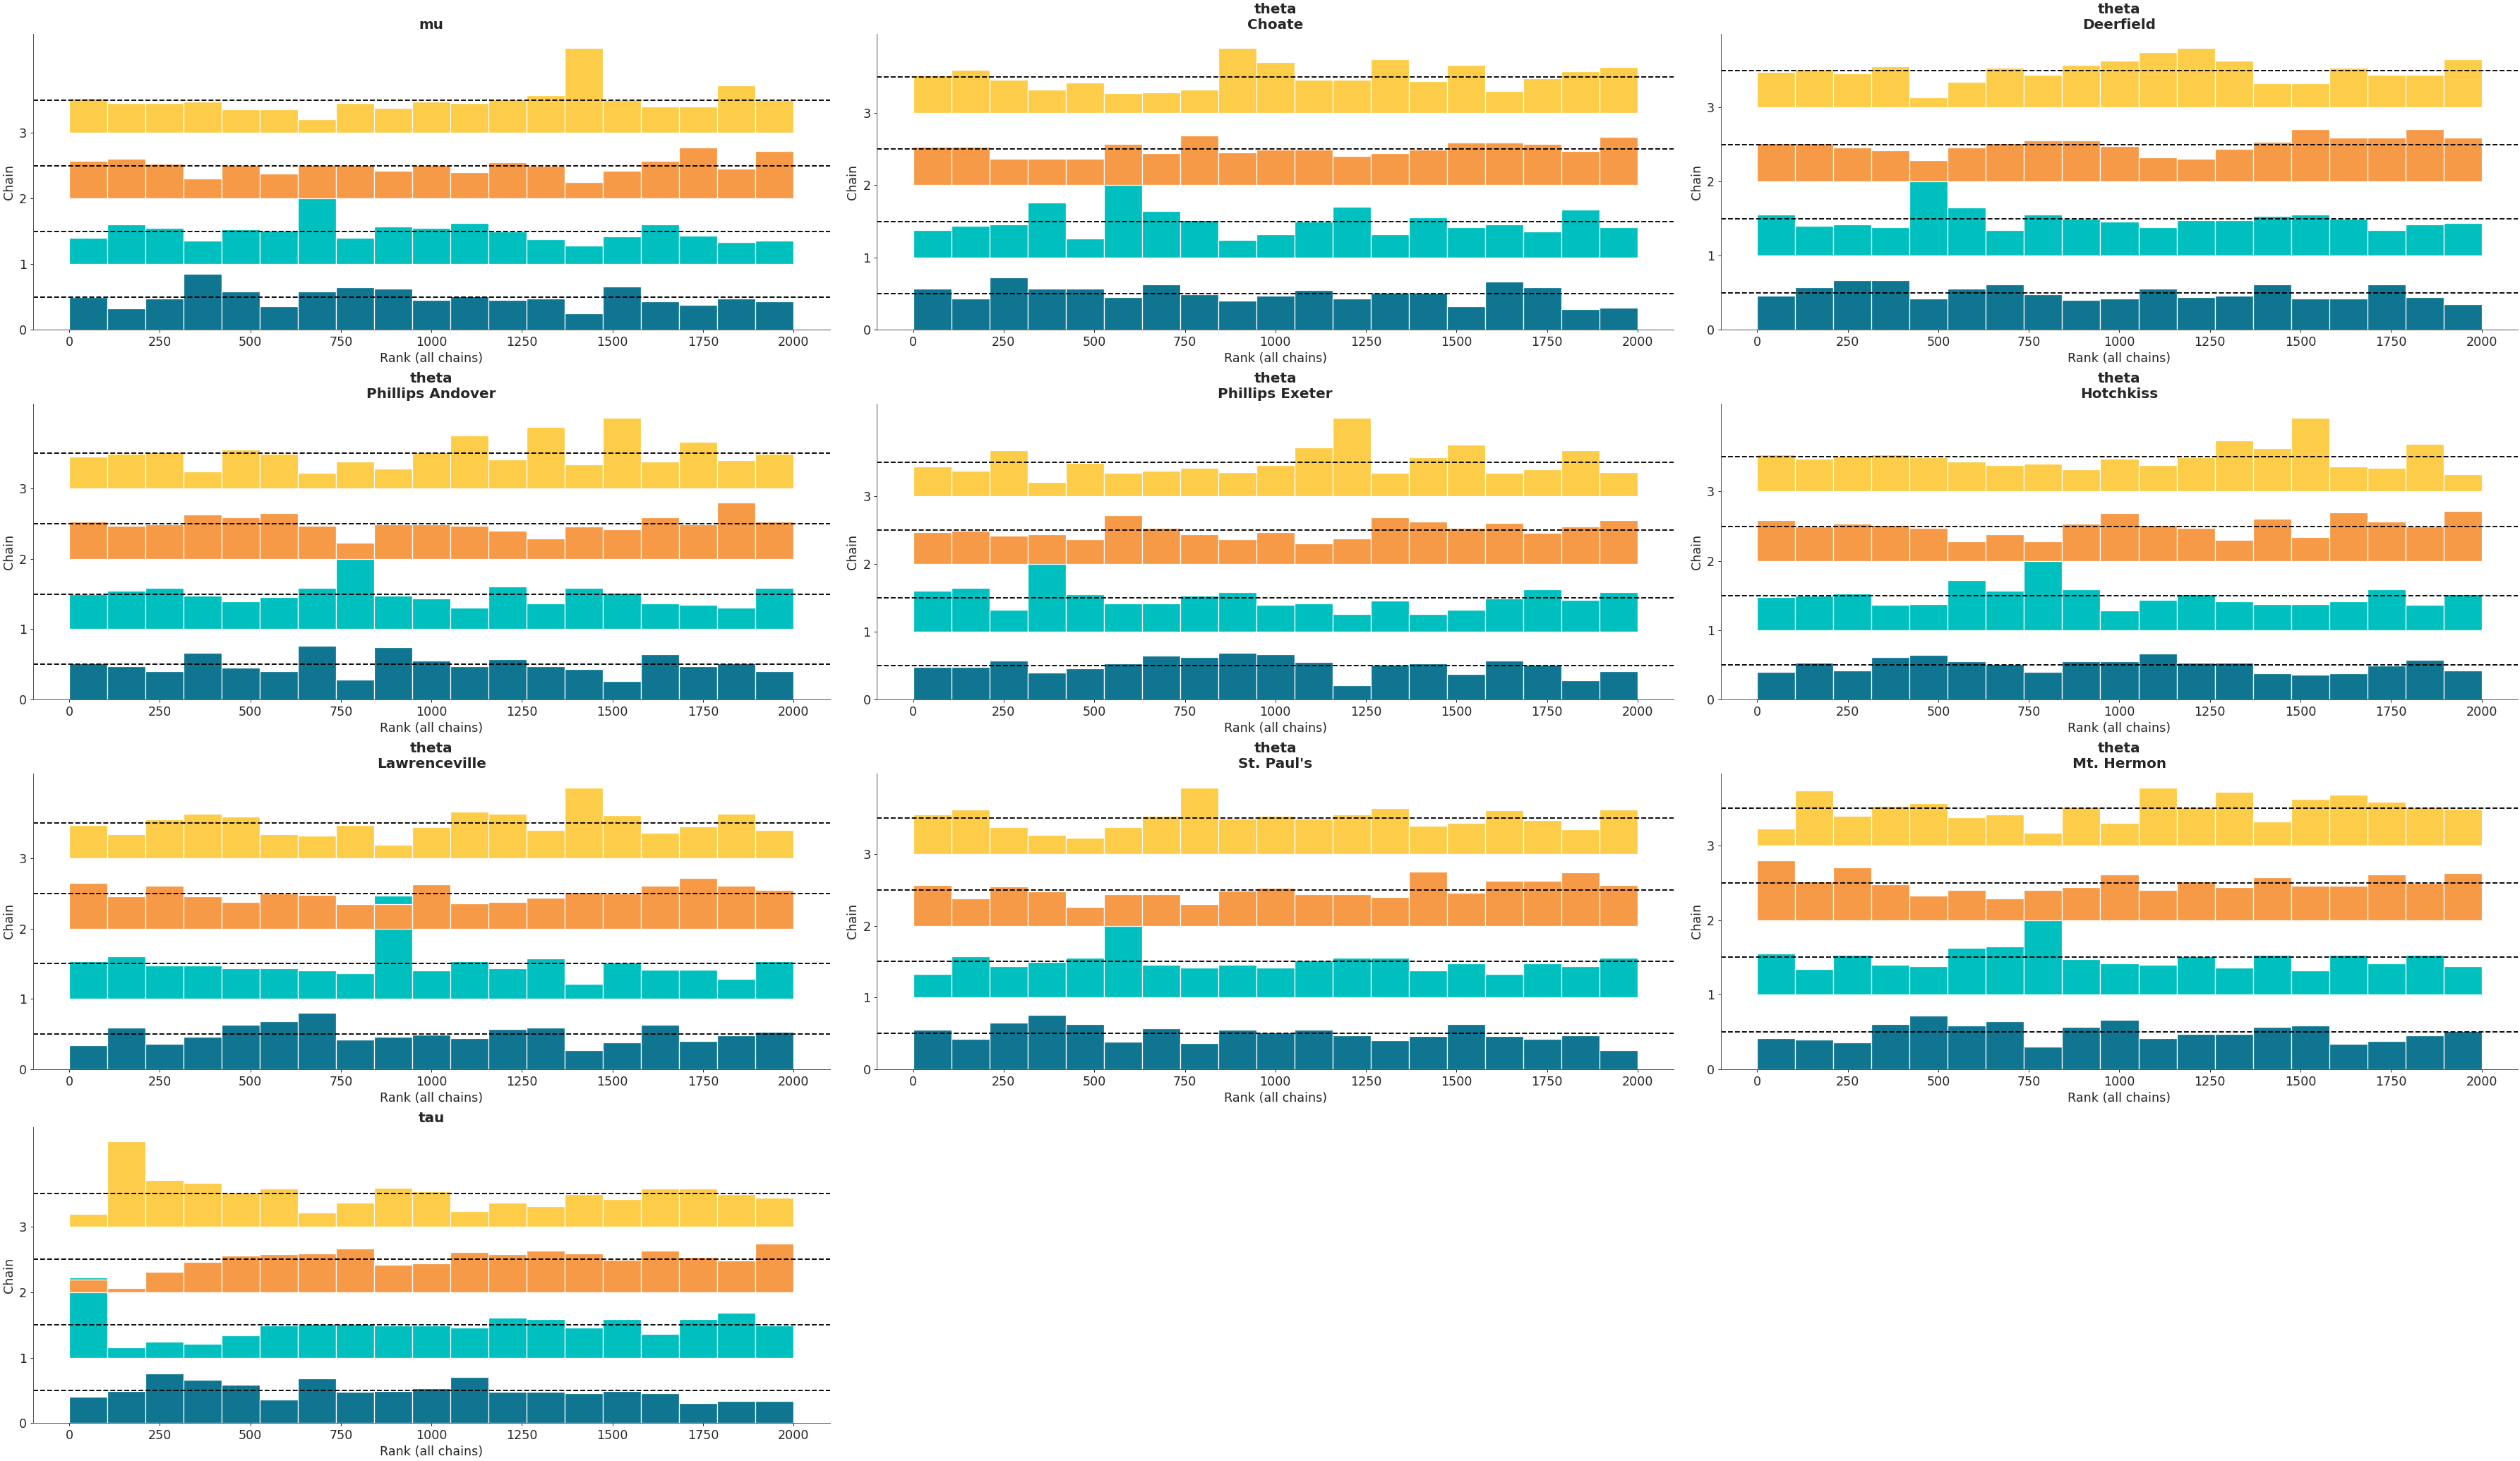
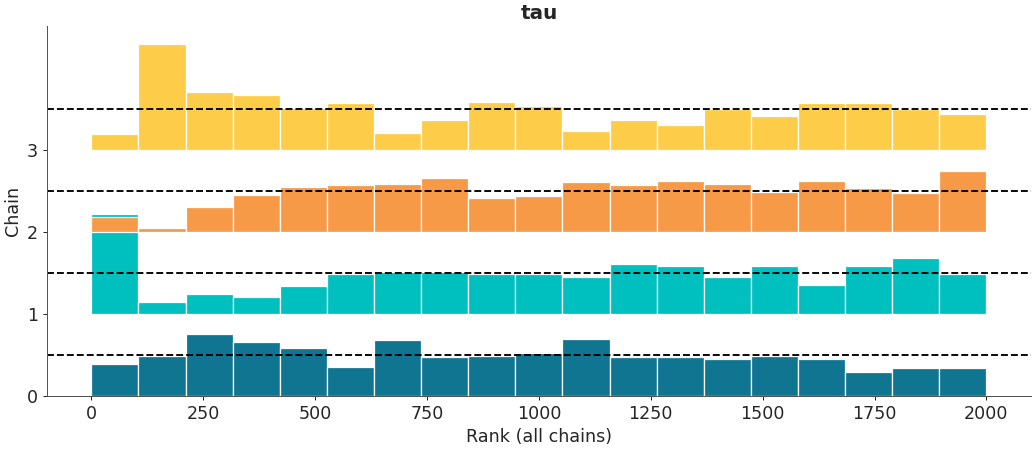
From the paper: Rank plots are histograms of the ranked posterior draws (ranked over all chains) plotted separately for each chain. If all of the chains are targeting the same posterior, we expect the ranks in each chain to be uniform, whereas if one chain has a different location or scale parameter, this will be reflected in the deviation from uniformity. If rank plots of all chains look similar, this indicates good mixing of the chains.
This plot was introduced by Aki Vehtari, Andrew Gelman, Daniel Simpson, Bob Carpenter, Paul-Christian Burkner (2019): Rank-normalization, folding, and localization: An improved R-hat for assessing convergence of MCMC. arXiv preprint https://arxiv.org/abs/1903.08008
- Parameters:
- data: obj
Any object that can be converted to an
arviz.InferenceDataobject. Refer to documentation ofarviz.convert_to_dataset()for details- var_names: string or list of variable names
Variables to be plotted. Prefix the variables by
~when you want to exclude them from the plot.- filter_vars: {None, “like”, “regex”}, optional, default=None
If
None(default), interpret var_names as the real variables names. If “like”, interpret var_names as substrings of the real variables names. If “regex”, interpret var_names as regular expressions on the real variables names. A lapandas.filter.- transform: callable
Function to transform data (defaults to None i.e.the identity function)
- coords: mapping, optional
Coordinates of var_names to be plotted. Passed to
xarray.Dataset.sel()- bins: None or passed to np.histogram
Binning strategy used for histogram. By default uses twice the result of Sturges’ formula. See
numpy.histogram()documentation for, other available arguments.- kind: string
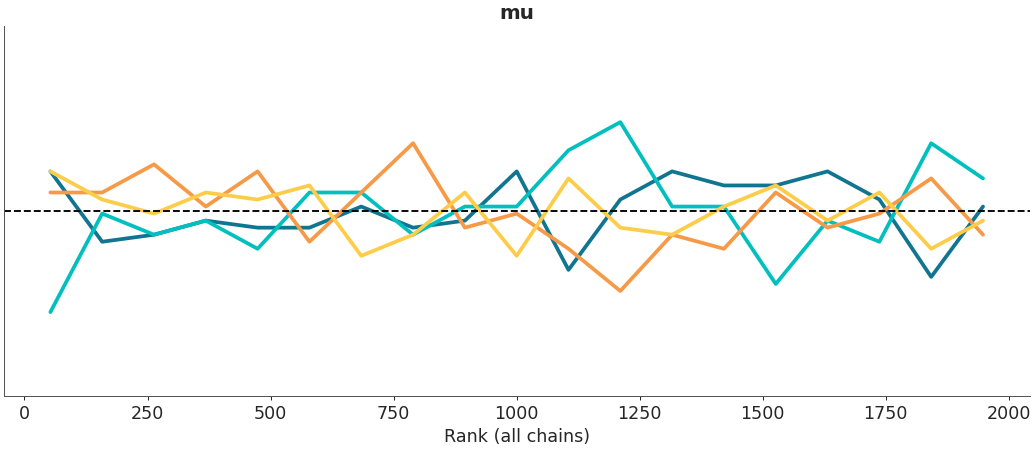
If bars (defaults), ranks are represented as stacked histograms (one per chain). If vlines ranks are represented as vertical lines above or below
ref_line.- colors: string or list of strings
List with valid matplotlib colors, one color per model. Alternative a string can be passed. If the string is
cycle, it will automatically choose a color per model from matplotlib’s cycle. If a single color is passed, e.g. ‘k’, ‘C2’ or ‘red’ this color will be used for all models. Defaults tocycle.- ref_line: boolean
Whether to include a dashed line showing where a uniform distribution would lie
- labels: bool
whether to plot or not the x and y labels, defaults to True
- labeller
labellerinstance, optional Class providing the method
make_label_vertto generate the labels in the plot titles. Read the Label guide for more details and usage examples.- grid
tuple Number of rows and columns. Defaults to None, the rows and columns are automatically inferred.
- figsize: tuple
Figure size. If None it will be defined automatically.
- ax: numpy array-like of matplotlib axes or bokeh figures, optional
A 2D array of locations into which to plot the densities. If not supplied, ArviZ will create its own array of plot areas (and return it).
- backend: str, optional
Select plotting backend {“matplotlib”,”bokeh”}. Default “matplotlib”.
- ref_line_kwargs
dict, optional Reference line keyword arguments, passed to
matplotlib.axes.Axes.axhline()orbokeh.models.Span.- bar_kwargs
dict, optional Bars keyword arguments, passed to
matplotlib.axes.Axes.bar()orbokeh:bokeh.plotting.Figure.vbar().- vlines_kwargs
dict, optional Vlines keyword arguments, passed to
matplotlib.axes.Axes.vlines()orbokeh:bokeh.plotting.Figure.multi_line().- marker_vlines_kwargs
dict, optional Marker for the vlines keyword arguments, passed to
matplotlib.axes.Axes.plot()orbokeh:bokeh.plotting.Figure.circle().- backend_kwargs: bool, optional
These are kwargs specific to the backend being used, passed to
matplotlib.pyplot.subplots()orbokeh.plotting.figure(). For additional documentation check the plotting method of the backend.- show: bool, optional
Call backend show function.
- Returns:
- axes:
matplotlibaxesorbokehfigures
- axes:
See also
plot_tracePlot distribution (histogram or kernel density estimates) and sampled values or rank plot.
Examples
Show a default rank plot
>>> import arviz as az
>>> data = az.load_arviz_data('centered_eight')
>>> az.plot_rank(data)

Recreate Figure 13 from the arxiv preprint
>>> data = az.load_arviz_data('centered_eight')
>>> az.plot_rank(data, var_names='tau')

Use vlines to compare results for centered vs noncentered models
>>> import matplotlib.pyplot as plt
>>> centered_data = az.load_arviz_data('centered_eight')
>>> noncentered_data = az.load_arviz_data('non_centered_eight')
>>> _, ax = plt.subplots(1, 2, figsize=(12, 3))
>>> az.plot_rank(centered_data, var_names="mu", kind='vlines', ax=ax[0])
>>> az.plot_rank(noncentered_data, var_names="mu", kind='vlines', ax=ax[1])

Change the aesthetics using kwargs
>>> az.plot_rank(noncentered_data, var_names="mu", kind="vlines",
>>>              vlines_kwargs={'lw':0}, marker_vlines_kwargs={'lw':3});

