Energy Plot#
API documentation: plot_energy()
Python source code: [download source: matplotlib/mpl_plot_energy.py]
import matplotlib.pyplot as plt
import arviz as az
az.style.use("arviz-darkgrid")
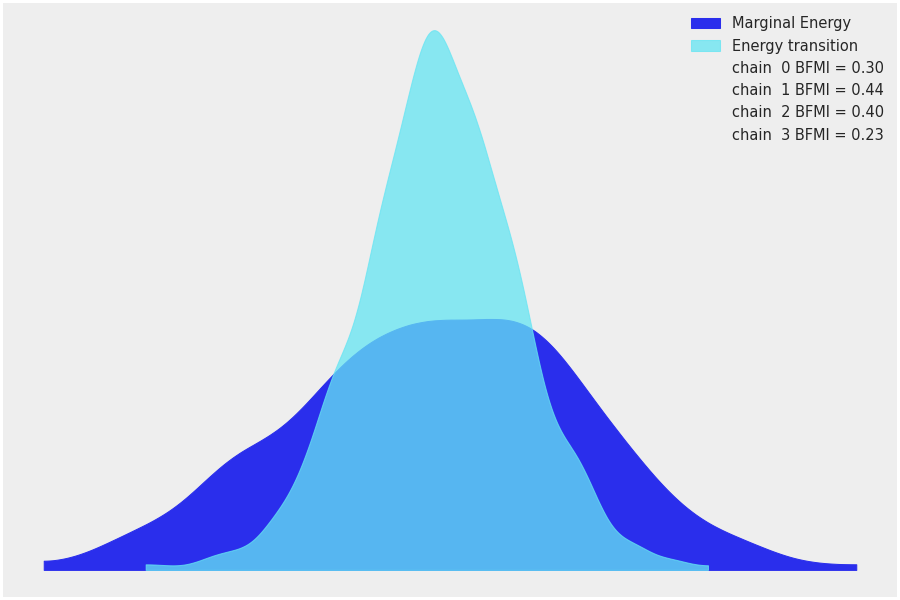
data = az.load_arviz_data("centered_eight")
az.plot_energy(data, figsize=(12, 8))
plt.show()
Python source code: [download source: bokeh/bokeh_plot_energy.py]
import arviz as az

data = az.load_arviz_data("centered_eight")
ax = az.plot_energy(data, figsize=(12, 8), backend="bokeh")