arviz.plot_energy#
- arviz.plot_energy(data, kind=None, bfmi=True, figsize=None, legend=True, fill_alpha=(1, 0.75), fill_color=('C0', 'C5'), bw='experimental', textsize=None, fill_kwargs=None, plot_kwargs=None, ax=None, backend=None, backend_kwargs=None, show=None)[source]#
Plot energy transition distribution and marginal energy distribution in HMC algorithms.
This may help to diagnose poor exploration by gradient-based algorithms like HMC or NUTS.
- Parameters
- dataobj
xarray.Dataset, or any object that can be converted (must representsample_statsand have anenergyvariable).- kindstr
Type of plot to display (“kde”, “hist”).
- bfmibool
If True add to the plot the value of the estimated Bayesian fraction of missing information
- figsizetuple
Figure size. If None it will be defined automatically.
- legendbool
Flag for plotting legend. Defaults to True.
- fill_alphatuple of floats
Alpha blending value for the shaded area under the curve, between 0 (no shade) and 1 (opaque). Defaults to (1, .75).
- fill_colortuple of valid matplotlib color
Color for Marginal energy distribution and Energy transition distribution. Defaults to (‘C0’, ‘C5’).
- bw: float or str, optional
If numeric, indicates the bandwidth and must be positive. If str, indicates the method to estimate the bandwidth and must be one of “scott”, “silverman”, “isj” or “experimental”. Defaults to “experimental”. Only works if
kind='kde'.- textsize: float
Text size scaling factor for labels, titles and lines. If None it will be autoscaled based on figsize.
- fill_kwargsdicts, optional
Additional keywords passed to
arviz.plot_kde()(to control the shade).- plot_kwargsdicts, optional
Additional keywords passed to
arviz.plot_kde()ormatplotlib.pyplot.hist()(iftype='hist').- ax: axes, optional
- backend: str, optional
Select plotting backend {“matplotlib”, “bokeh”}. Defaults to “matplotlib”.
- backend_kwargs: bool, optional
These are kwargs specific to the backend being used, passed to
matplotlib.pyplot.subplots()orbokeh.plotting.figure().- showbool, optional
Call backend show function.
- Returns
- axesmatplotlib axes or bokeh figures
See also
bfmiCalculate the estimated Bayesian fraction of missing information (BFMI).
Examples
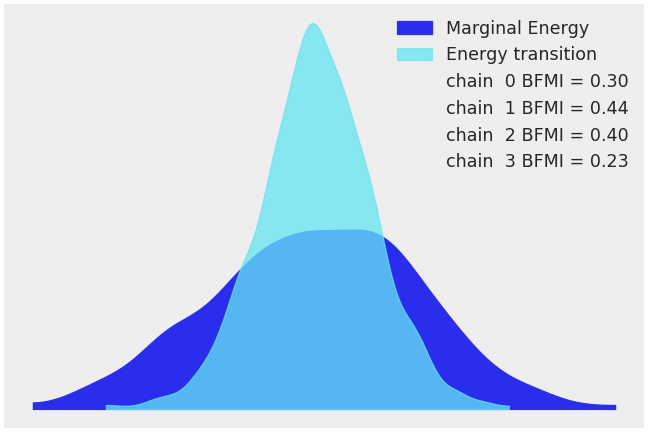
Plot a default energy plot
>>> import arviz as az
>>> data = az.load_arviz_data('centered_eight')
>>> az.plot_energy(data)
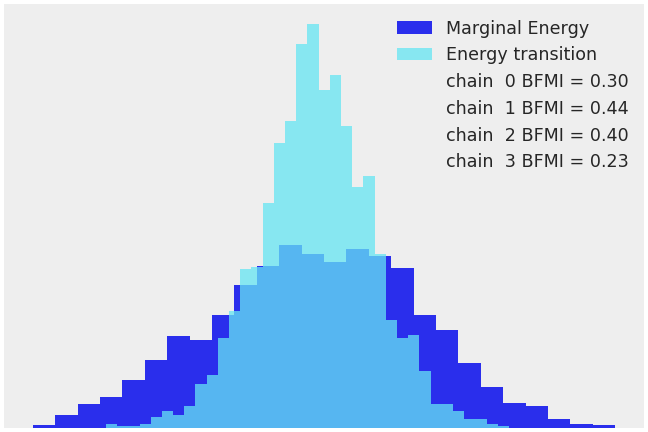
Represent energy plot via histograms
>>> az.plot_energy(data, kind='hist')