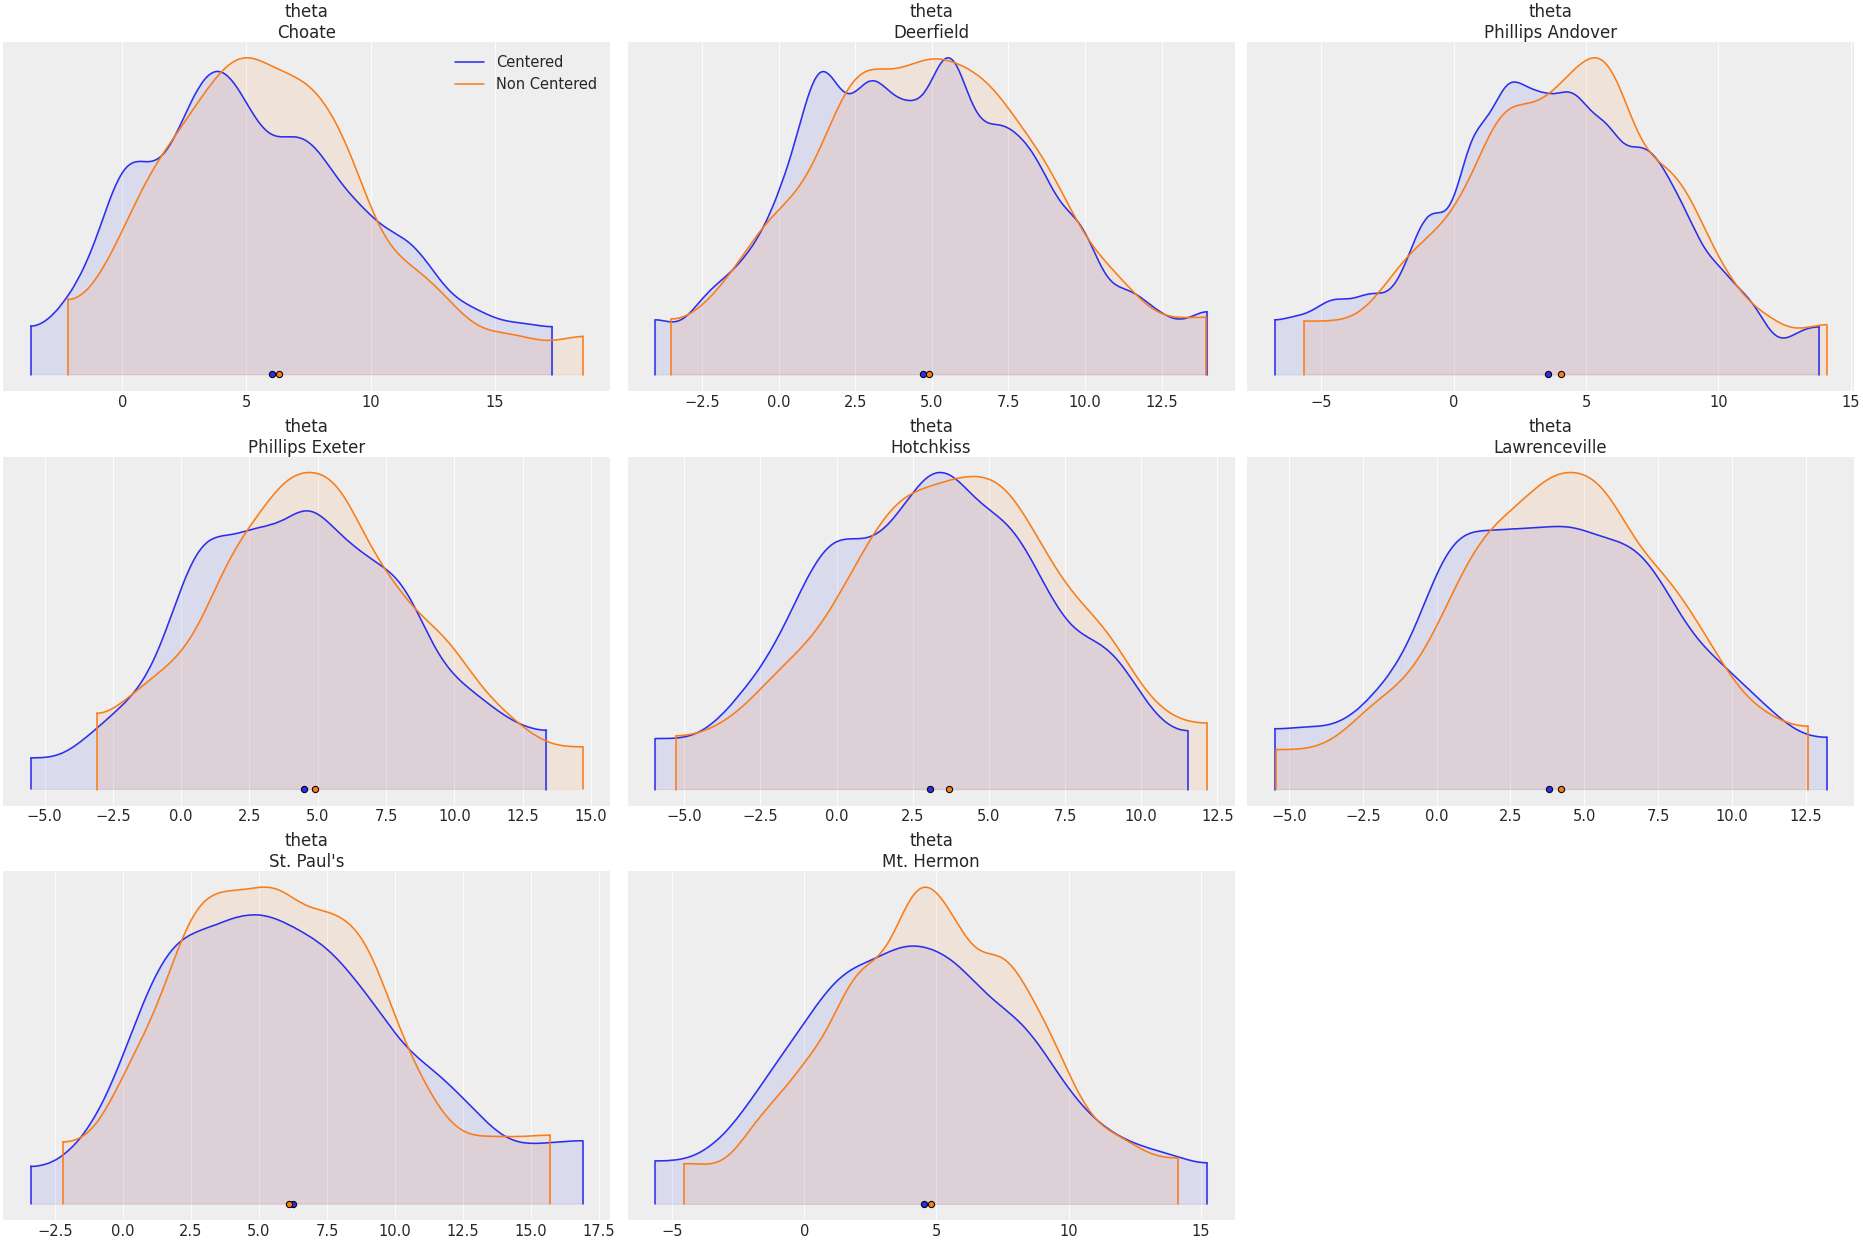
Density Plot#
API documentation: plot_density()
Python source code: [download source: matplotlib/mpl_plot_density.py]
import matplotlib.pyplot as plt

import arviz as az

az.style.use("arviz-darkgrid")

centered_data = az.load_arviz_data("centered_eight")
non_centered_data = az.load_arviz_data("non_centered_eight")
az.plot_density(
    [centered_data, non_centered_data],
    data_labels=["Centered", "Non Centered"],
    var_names=["theta"],
    shade=0.1,
)
plt.show()
Python source code: [download source: bokeh/bokeh_plot_density.py]
import arviz as az

centered_data = az.load_arviz_data("centered_eight")
non_centered_data = az.load_arviz_data("non_centered_eight")
ax = az.plot_density(
    [centered_data, non_centered_data],
    data_labels=["Centered", "Non Centered"],
    var_names=["theta"],
    shade=0.1,
    backend="bokeh",
)