Dist Plot#
API documentation: plot_dist()
Python source code: [download source: matplotlib/mpl_plot_dist.py]
import matplotlib.pyplot as plt
import numpy as np
import arviz as az
az.style.use("arviz-darkgrid")
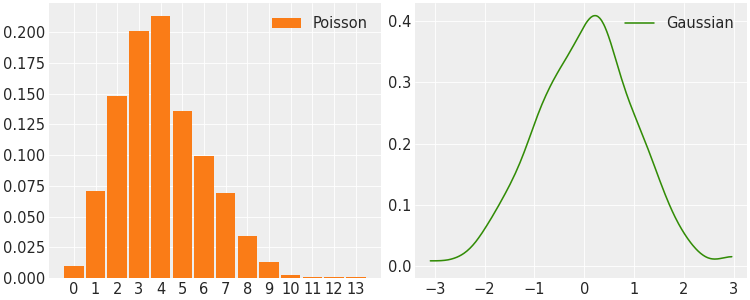
a = np.random.poisson(4, 1000)
b = np.random.normal(0, 1, 1000)
_, ax = plt.subplots(1, 2, figsize=(10, 4))
az.plot_dist(a, color="C1", label="Poisson", ax=ax[0])
az.plot_dist(b, color="C2", label="Gaussian", ax=ax[1])
plt.show()
Python source code: [download source: bokeh/bokeh_plot_dist.py]
import bokeh.plotting as bkp
import numpy as np
from bokeh.layouts import row

import arviz as az

a = np.random.poisson(4, 1000)
b = np.random.normal(0, 1, 1000)

figure_kwargs = dict(height=500, width=500, output_backend="webgl")
ax_poisson = bkp.figure(**figure_kwargs)
ax_normal = bkp.figure(**figure_kwargs)

az.plot_dist(a, color="black", label="Poisson", ax=ax_poisson, backend="bokeh", show=False)
az.plot_dist(b, color="red", label="Gaussian", ax=ax_normal, backend="bokeh", show=False)

ax = row(ax_poisson, ax_normal)

if az.rcParams["plot.bokeh.show"]:
    bkp.show(ax)