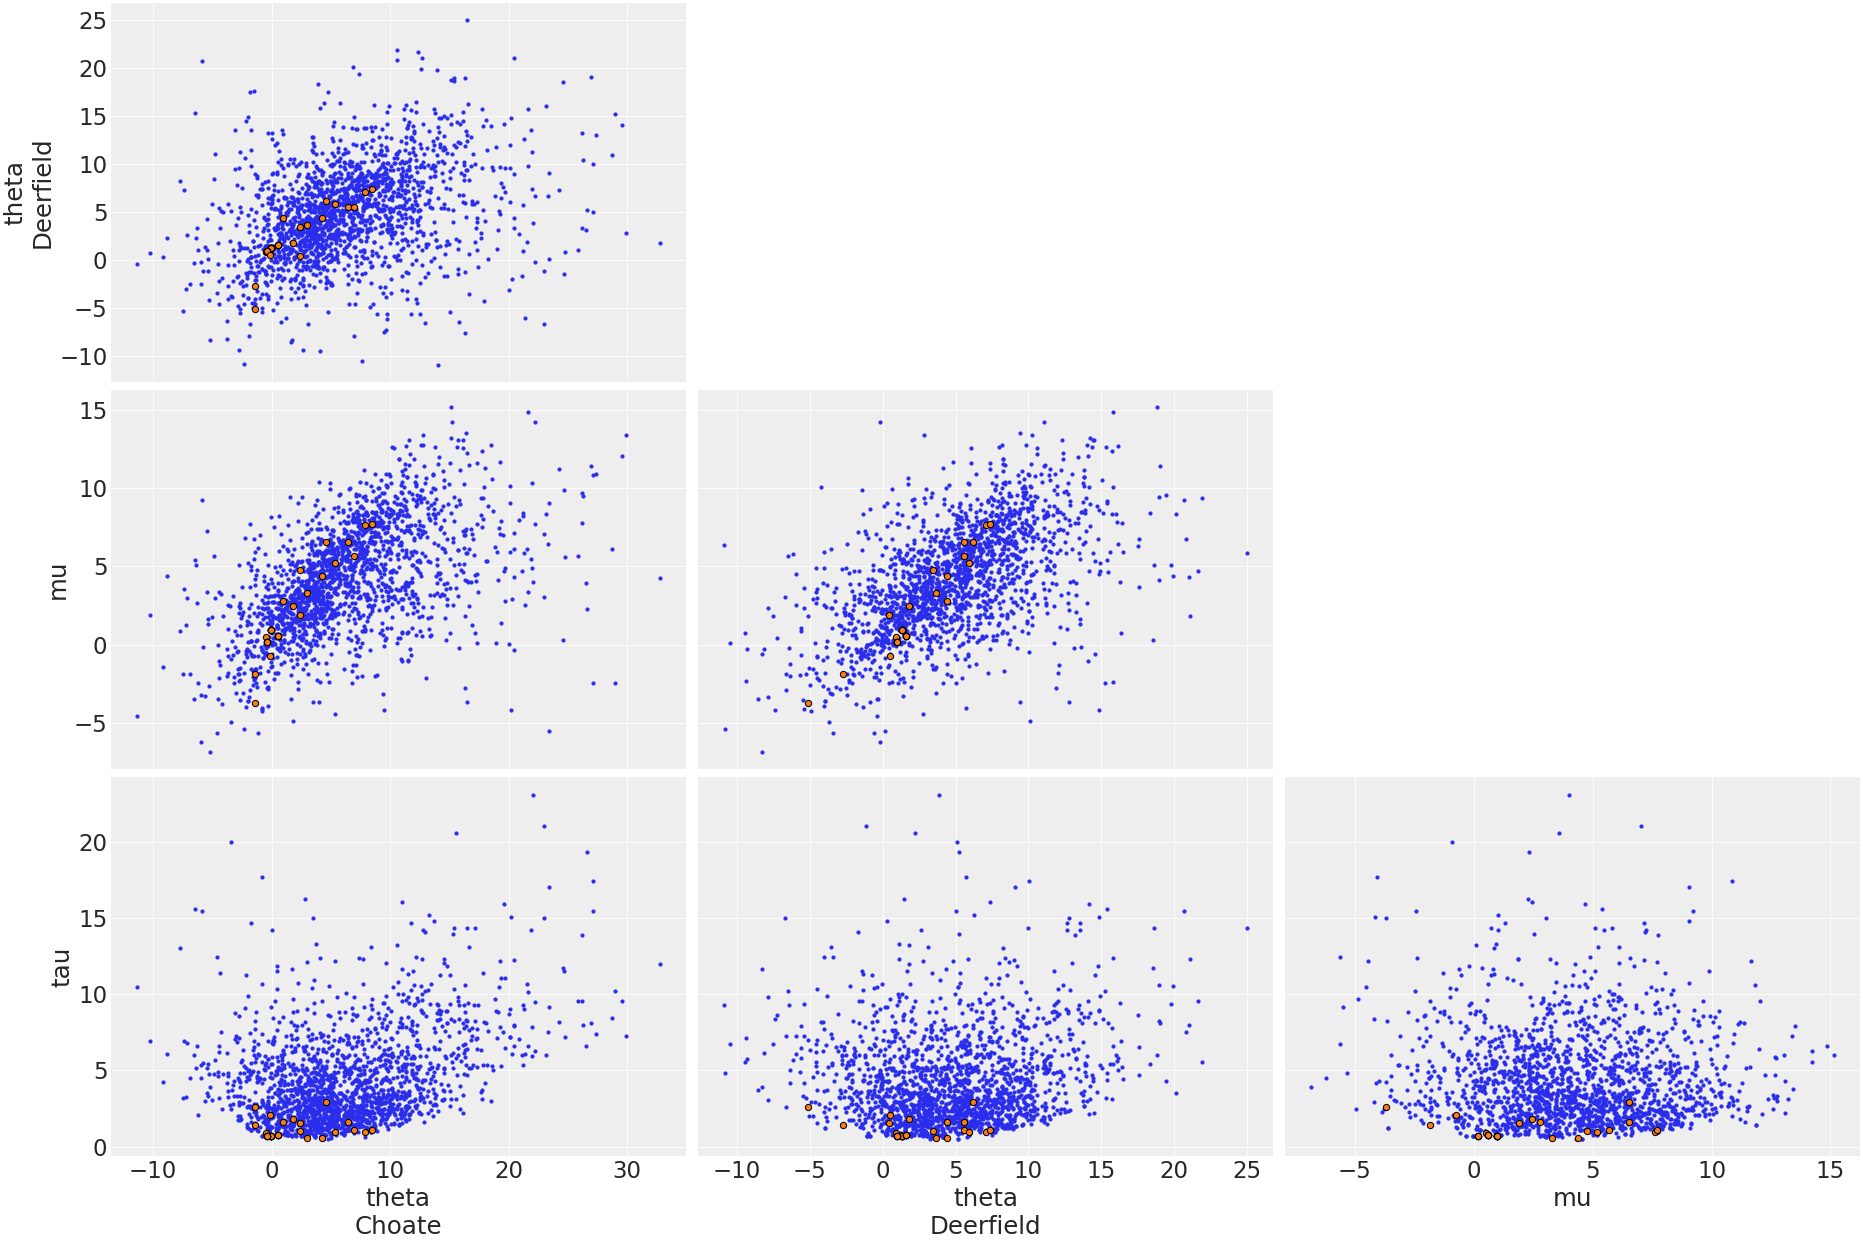
Pair Plot#
API documentation: plot_pair()
Python source code: [download source: matplotlib/mpl_plot_pair.py]
import matplotlib.pyplot as plt

import arviz as az

az.style.use("arviz-darkgrid")

centered = az.load_arviz_data("centered_eight")

coords = {"school": ["Choate", "Deerfield"]}
az.plot_pair(
    centered, var_names=["theta", "mu", "tau"], coords=coords, divergences=True, textsize=22
)
plt.show()
Python source code: [download source: bokeh/bokeh_plot_pair.py]
import arviz as az

centered = az.load_arviz_data("centered_eight")

coords = {"school": ["Choate", "Deerfield"]}
ax = az.plot_pair(
    centered, var_names=["theta", "mu", "tau"], coords=coords, divergences=True, backend="bokeh"
)