KDE Plot#
API documentation: plot_kde()
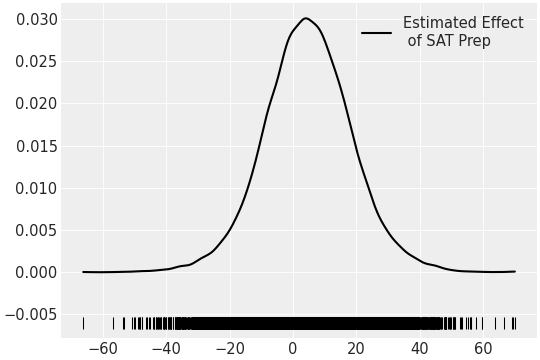
Python source code: [download source: matplotlib/mpl_plot_kde.py]
import matplotlib.pyplot as plt
import numpy as np

import arviz as az

az.style.use("arviz-darkgrid")

data = az.load_arviz_data("centered_eight")

# Combine posterior draws for from xarray of (4,500) to ndarray (2000,)
y_hat = np.concatenate(data.posterior_predictive["obs"].values)

ax = az.plot_kde(
    y_hat,
    label="Estimated Effect\n of SAT Prep",
    rug=True,
    plot_kwargs={"linewidth": 2, "color": "black"},
    rug_kwargs={"color": "black"},
)
plt.show()
Python source code: [download source: bokeh/bokeh_plot_kde.py]
import bokeh.plotting as bkp
import numpy as np

import arviz as az

data = az.load_arviz_data("centered_eight")

# Combine posterior draws for from xarray of (4,500) to ndarray (2000,)
y_hat = np.concatenate(data.posterior_predictive["obs"].values)

figure_kwargs = dict(height=500, width=500, output_backend="webgl")
ax = bkp.figure(**figure_kwargs)

ax = az.plot_kde(
    y_hat,
    label="Estimated Effect\n of SAT Prep",
    rug=True,
    plot_kwargs={"line_width": 2, "line_color": "black"},
    rug_kwargs={"line_color": "black"},
    backend="bokeh",
    ax=ax,
)