KDE quantiles#
API documentation: plot_kde()
Python source code: [download source: matplotlib/mpl_plot_kde_quantiles.py]
import matplotlib.pyplot as plt
import numpy as np
import arviz as az
az.style.use("arviz-darkgrid")
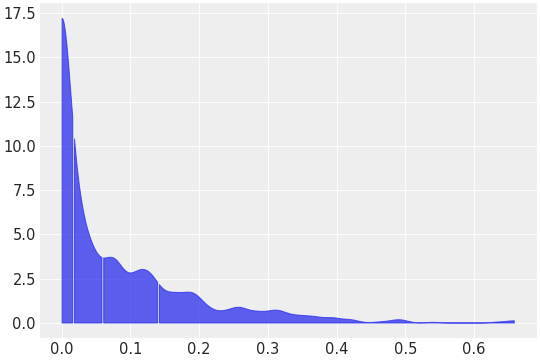
dist = np.random.beta(np.random.uniform(0.5, 10), 5, size=1000)
az.plot_kde(dist, quantiles=[0.25, 0.5, 0.75])
plt.show()
Python source code: [download source: bokeh/bokeh_plot_kde_quantiles.py]
import numpy as np

import arviz as az

dist = np.random.beta(np.random.uniform(0.5, 10), 5, size=1000)
ax = az.plot_kde(dist, quantiles=[0.25, 0.5, 0.75], backend="bokeh")