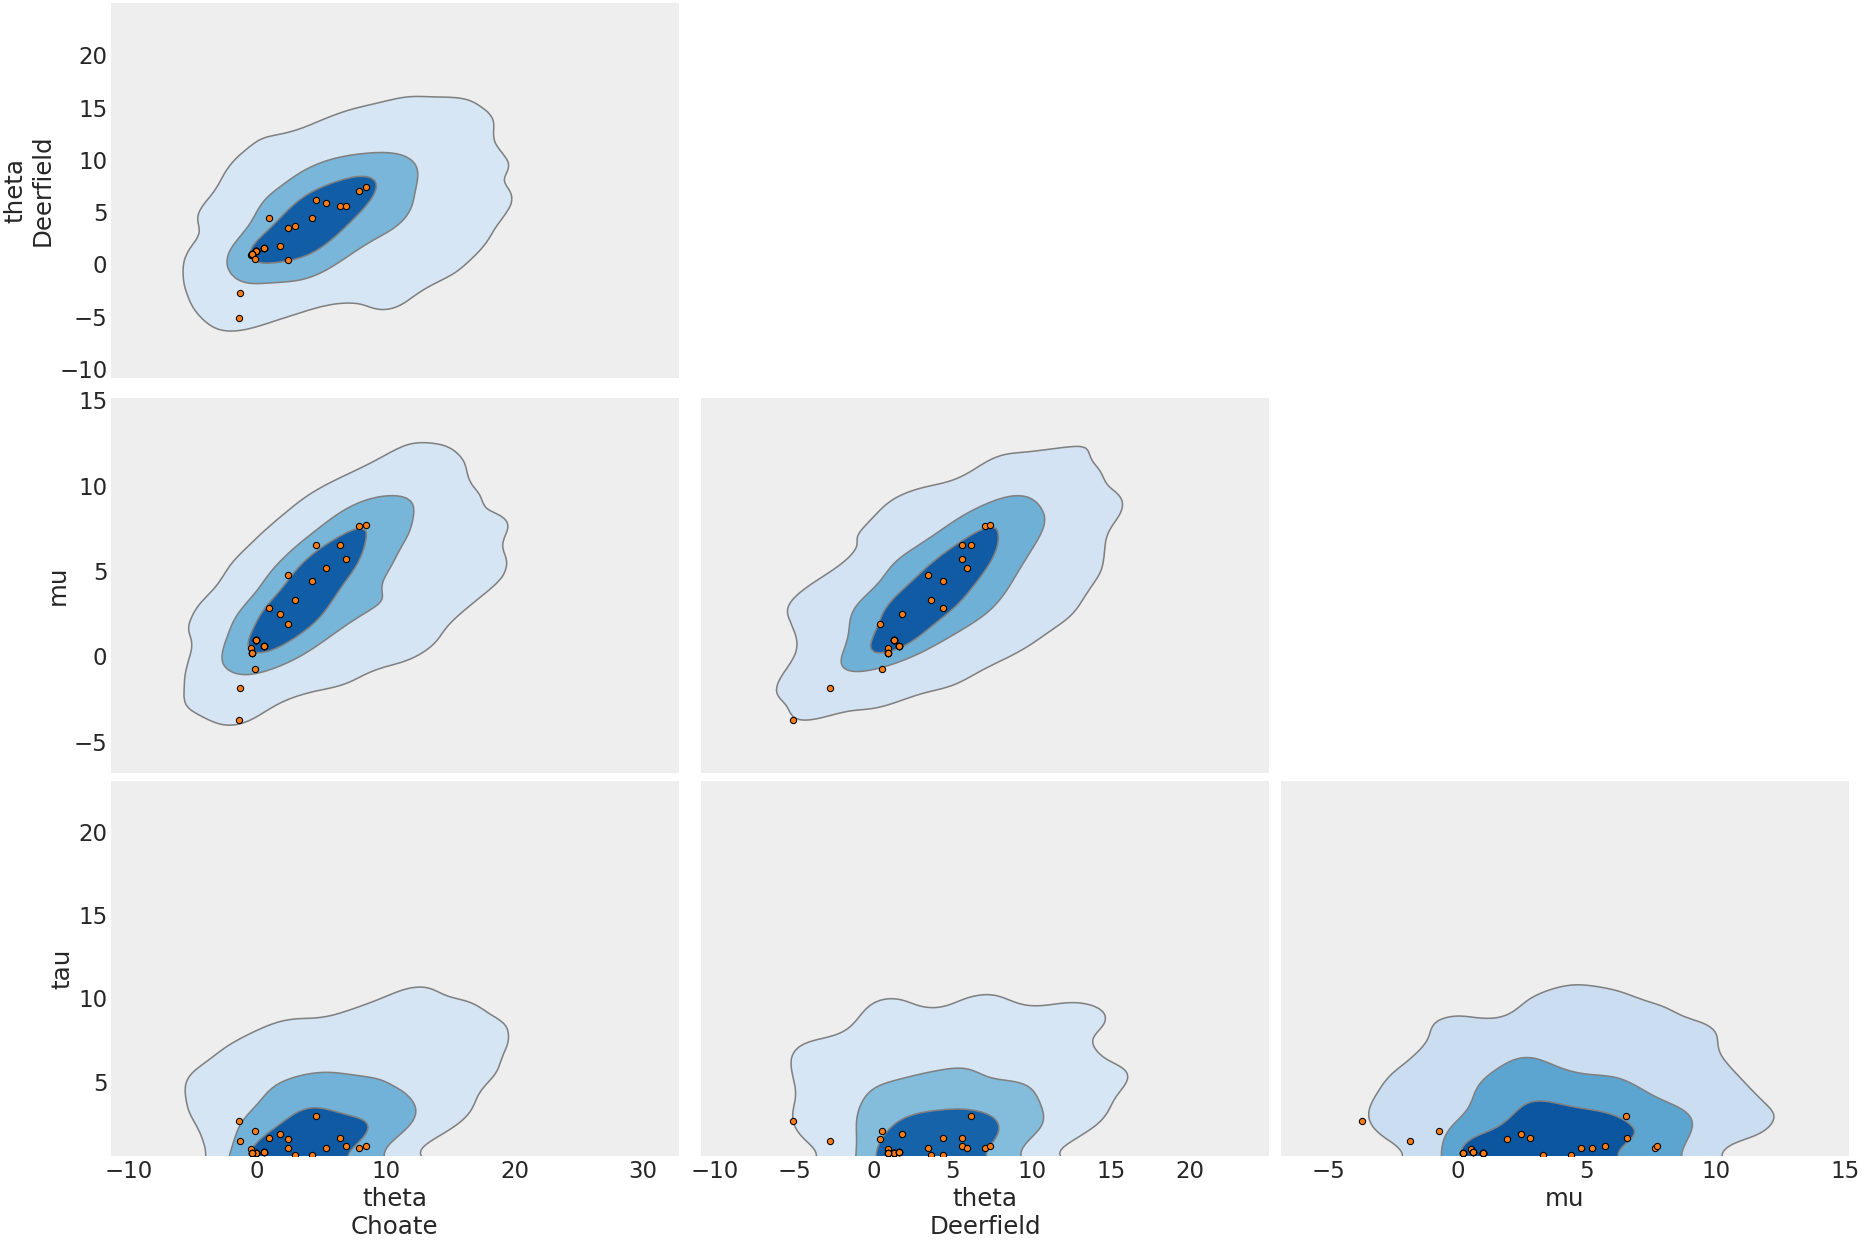
KDE Pair Plot with HDI Contours#
API documentation: plot_pair()
Python source code: [download source: matplotlib/mpl_plot_pair_kde_hdi.py]
import matplotlib.pyplot as plt

import arviz as az

az.style.use("arviz-darkgrid")

centered = az.load_arviz_data("centered_eight")

coords = {"school": ["Choate", "Deerfield"]}
az.plot_pair(
    centered,
    var_names=["theta", "mu", "tau"],
    kind="kde",
    coords=coords,
    divergences=True,
    textsize=22,
    kde_kwargs={
        "hdi_probs": [0.3, 0.6, 0.9],  # Plot 30%, 60% and 90% HDI contours
        "contourf_kwargs": {"cmap": "Blues"},
    },
)
plt.show()
Python source code: [download source: bokeh/bokeh_plot_pair_kde_hdi.py]
import arviz as az

az.style.use("arviz-darkgrid")

centered = az.load_arviz_data("centered_eight")

coords = {"school": ["Choate", "Deerfield"]}
az.plot_pair(
    centered,
    var_names=["theta", "mu", "tau"],
    kind="kde",
    coords=coords,
    divergences=True,
    textsize=22,
    kde_kwargs={
        "hdi_probs": [0.3, 0.6, 0.9],  # Plot 30%, 60% and 90% HDI contours
        "contourf_kwargs": {"cmap": "Blues"},
    },
    backend="bokeh",
)