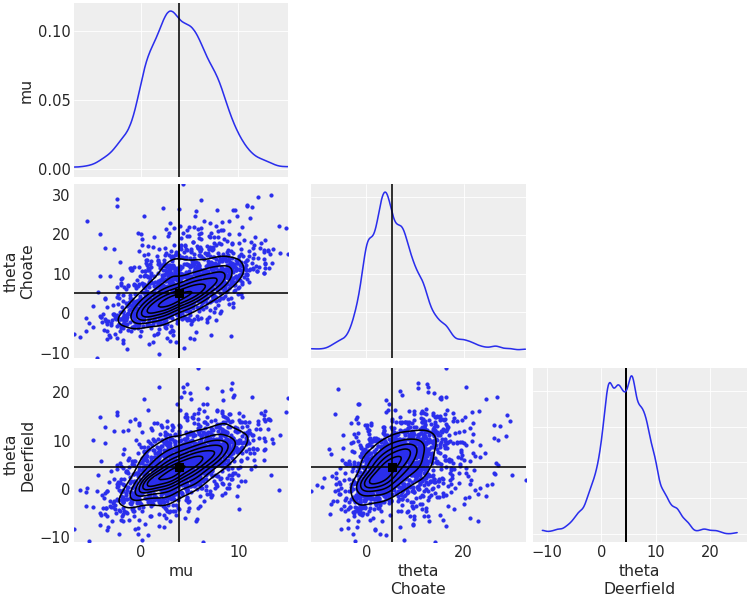
Point Estimate Pairplot#
API documentation: plot_pair()
Python source code: [download source: matplotlib/mpl_plot_pair_point_estimate.py]
import matplotlib.pyplot as plt

import arviz as az

centered = az.load_arviz_data("centered_eight")

coords = {"school": ["Choate", "Deerfield"]}
ax = az.plot_pair(
    centered,
    var_names=["mu", "theta"],
    kind=["scatter", "kde"],
    kde_kwargs={"fill_last": False},
    marginals=True,
    coords=coords,
    point_estimate="median",
    figsize=(10, 8),
)

plt.show()
Python source code: [download source: bokeh/bokeh_plot_pair_point_estimate.py]
import arviz as az

centered = az.load_arviz_data("centered_eight")

coords = {"school": ["Choate", "Deerfield"]}
ax = az.plot_pair(
    centered,
    var_names=["mu", "theta"],
    kind=["scatter", "kde"],
    kde_kwargs={"fill_last": False},
    marginals=True,
    coords=coords,
    point_estimate="median",
    figsize=(10, 8),
    backend="bokeh",
)