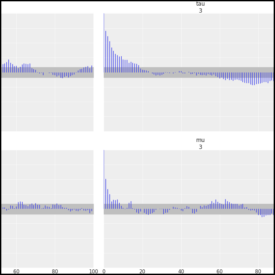
example_plot_autocorr
Autocorrelation Plot
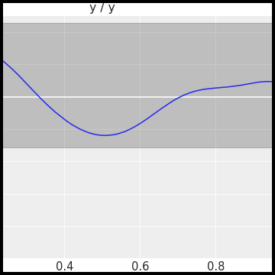
example_plot_bpv
Bayesian p-value Posterior plot
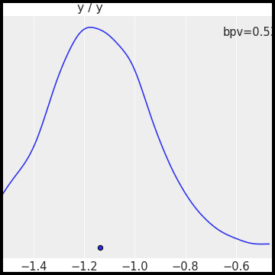
example_plot_bpv_tstat
Bayesian p-value with median T statistic Posterior plot
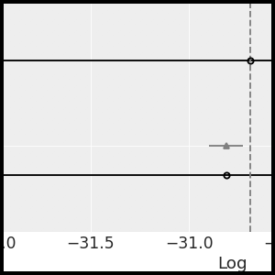
example_plot_compare
Compare Plot
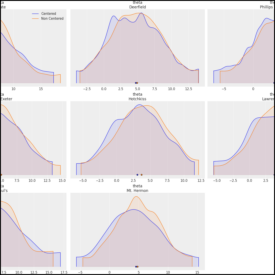
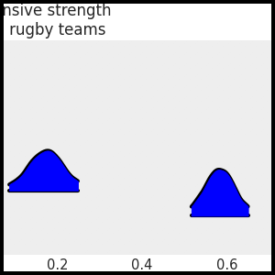
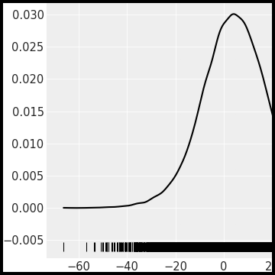
example_plot_density
Density Plot
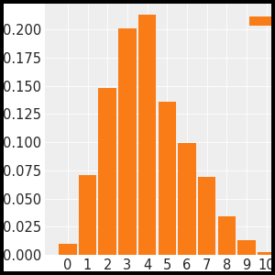
example_plot_dist
Dist Plot Bokeh
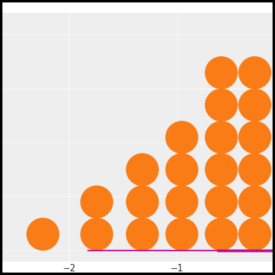
example_plot_dot
Plot distribution.
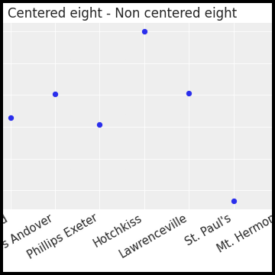
example_plot_elpd
ELPD Plot
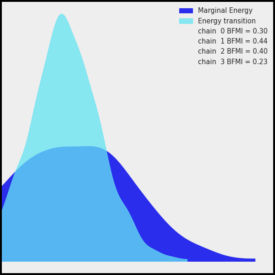
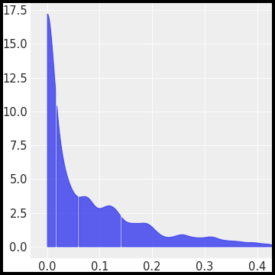
example_plot_energy
Energy Plot
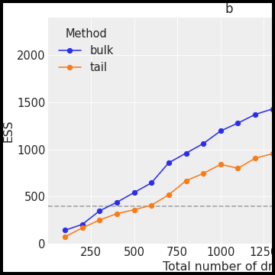
example_plot_ess_evolution
ESS Quantile Plot
example_plot_ess_local
ESS Local Plot
example_plot_ess_quantile
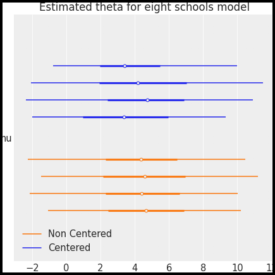
example_plot_forest
Forest Plot
example_plot_forest_ridge
Ridgeplot
example_plot_hdi
Plot HDI
example_plot_joint
Joint Plot
example_plot_kde
KDE Plot Bokeh
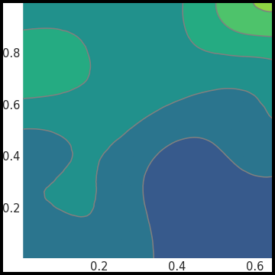
example_plot_kde_2d
2d KDE (default style)
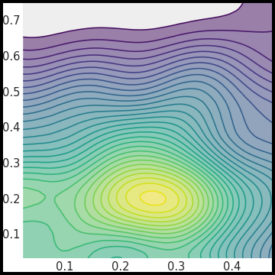
example_plot_kde_2d_bis
2d KDE (custom style)
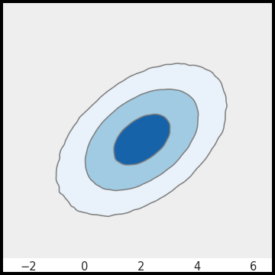
example_plot_kde_2d_hdi
2d KDE with HDI Contours
example_plot_kde_quantiles
KDE quantiles Bokeh
example_plot_khat
Pareto Shape Plot
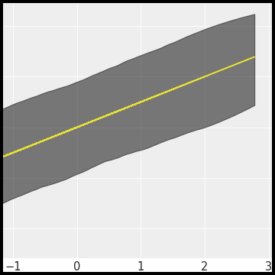
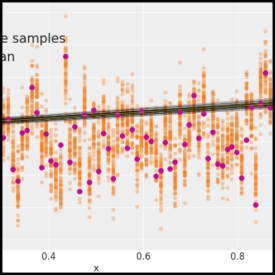
example_plot_lm
Regression Plot.
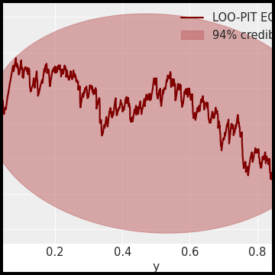
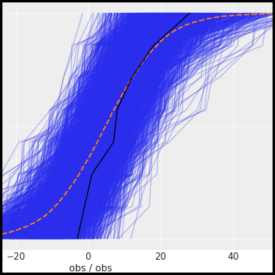
example_plot_loo_pit_ecdf
Plot LOO predictive ECDF compared to ECDF of uniform distribution to assess predictive calibration.
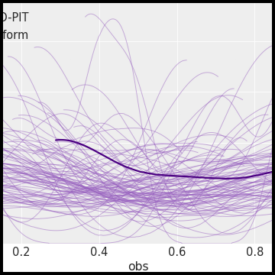
example_plot_loo_pit_overlay
Plot LOO-PIT KDE overlaid on KDEs of uniform samples to assess predictive calibration.
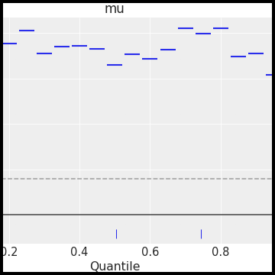
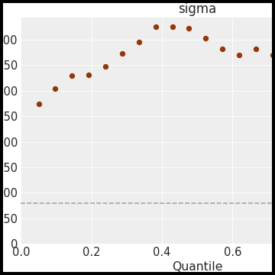
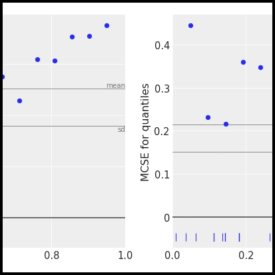
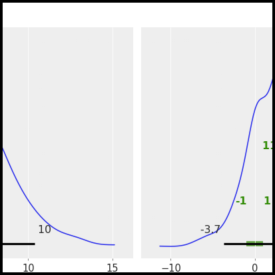
example_plot_mcse
Quantile Monte Carlo Standard Error Plot
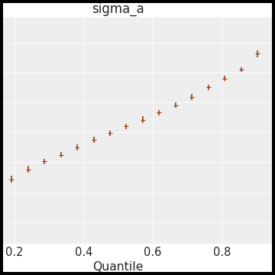
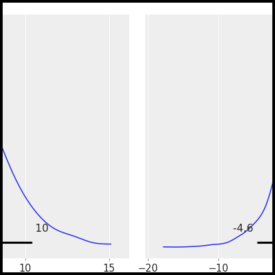
example_plot_mcse_errorbar
Quantile MCSE Errobar Plot
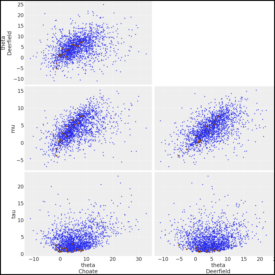
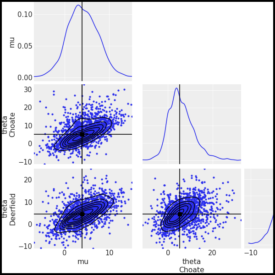
example_plot_pair
Pair Plot
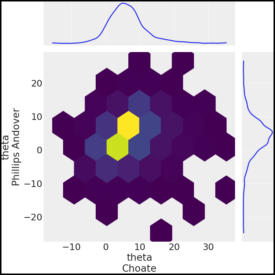
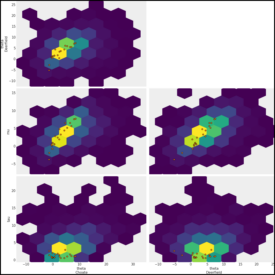
example_plot_pair_hex
Hexbin PairPlot
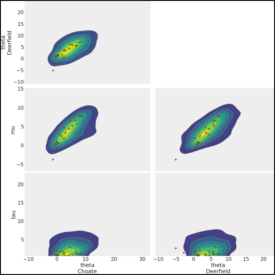
example_plot_pair_kde
KDE Pair Plot
example_plot_pair_kde_hdi
KDE Pair Plot with HDI Contours
example_plot_pair_point_estimate
Point Estimate Pairplot
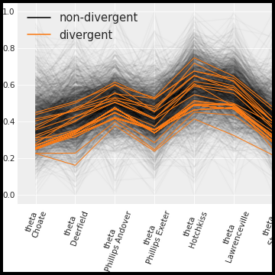
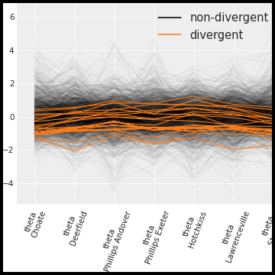
example_plot_parallel
Parallel Plot
example_plot_parallel_minmax
MinMax Parallel Plot
example_plot_parallel_normal
Normal Parallel Plot
example_plot_parallel_rank
Rank Parallel Plot
example_plot_posterior
Posterior Plot
example_plot_posterior_combinedims
Posterior Plot (reducing school dimension)
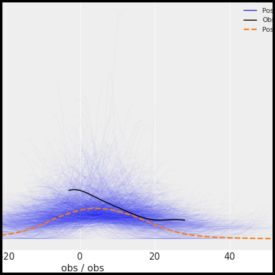
example_plot_ppc
Posterior Predictive Check Plot
example_plot_ppc_cumulative
Posterior Predictive Check Cumulative Plot
example_plot_rank
Rank plot
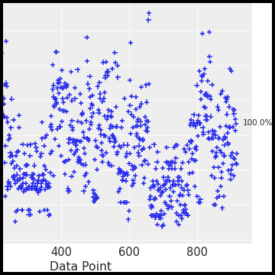
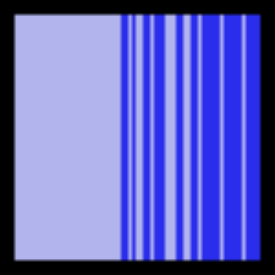
example_plot_separation
Separation Plot
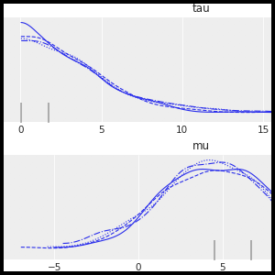
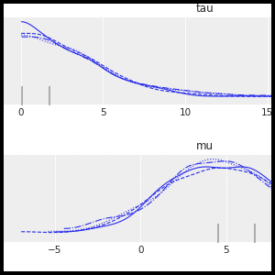
example_plot_trace
Traceplot Bokeh
example_plot_trace_bars
Traceplot rank_bars Bokeh
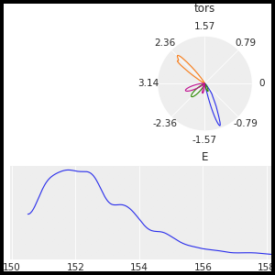
example_plot_trace_circ
Traceplot circular variables
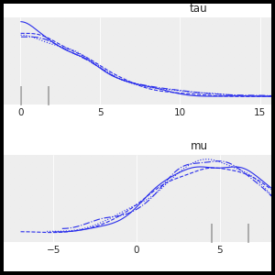
example_plot_trace_vlines
Traceplot rank_vlines Bokeh
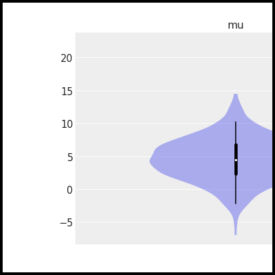
example_plot_violin
Violinplot
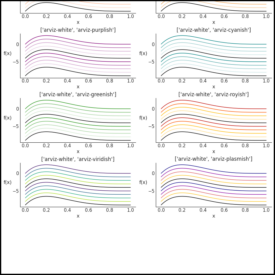
example_styles
Matplotlib styles for ArviZ
previous
Working with InferenceData
next