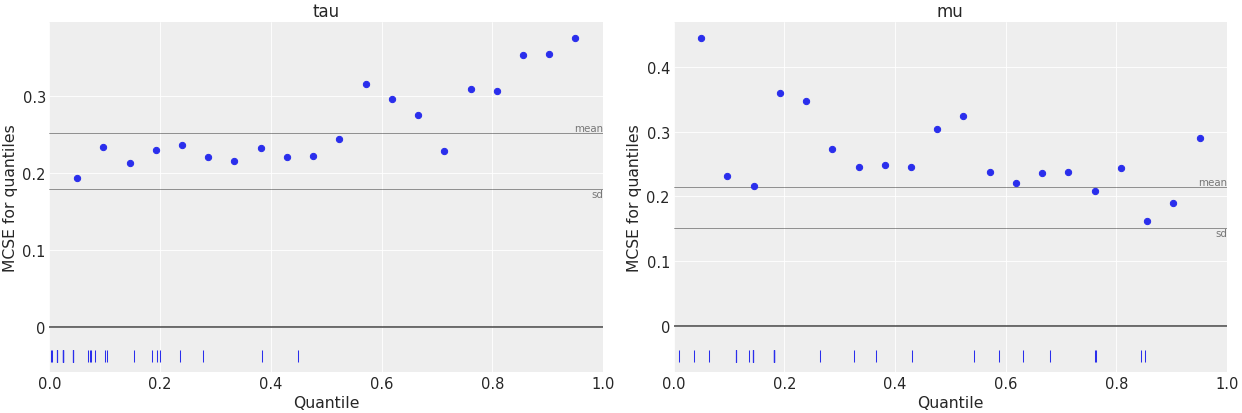
Quantile Monte Carlo Standard Error Plot#
API documentation: plot_mcse()
Python source code: [download source: matplotlib/mpl_plot_mcse.py]
import matplotlib.pyplot as plt

import arviz as az

az.style.use("arviz-darkgrid")

data = az.load_arviz_data("centered_eight")
az.plot_mcse(data, var_names=["tau", "mu"], rug=True, extra_methods=True)

plt.show()
Python source code: [download source: bokeh/bokeh_plot_mcse.py]
import arviz as az

data = az.load_arviz_data("centered_eight")
ax = az.plot_mcse(data, var_names=["tau", "mu"], rug=True, extra_methods=True, backend="bokeh")