arviz.plot_trace#
- arviz.plot_trace(data: arviz.data.inference_data.InferenceData, var_names: Optional[Sequence[str]] = None, filter_vars: Optional[str] = None, transform: Optional[Callable] = None, coords: Optional[Dict[str, List[Any]]] = None, divergences: Optional[str] = 'auto', kind: Optional[str] = 'trace', figsize: Optional[Tuple[float, float]] = None, rug: bool = False, lines: Optional[List[Tuple[str, Dict[str, List[Any]], Any]]] = None, circ_var_names: Optional[List[str]] = None, circ_var_units: str = 'radians', compact: bool = True, compact_prop: Optional[Union[str, Mapping[str, Any]]] = None, combined: bool = False, chain_prop: Optional[Union[str, Mapping[str, Any]]] = None, legend: bool = False, plot_kwargs: Optional[Dict[str, Any]] = None, fill_kwargs: Optional[Dict[str, Any]] = None, rug_kwargs: Optional[Dict[str, Any]] = None, hist_kwargs: Optional[Dict[str, Any]] = None, trace_kwargs: Optional[Dict[str, Any]] = None, rank_kwargs: Optional[Dict[str, Any]] = None, labeller=None, axes=None, backend: Optional[str] = None, backend_config: Optional[Dict[str, Any]] = None, backend_kwargs: Optional[Dict[str, Any]] = None, show: Optional[bool] = None)[source]#
Plot distribution (histogram or kernel density estimates) and sampled values or rank plot.
If divergences data is available in sample_stats, will plot the location of divergences as dashed vertical lines.
- Parameters
- data: obj
Any object that can be converted to an
arviz.InferenceDataobject Refer to documentation ofarviz.convert_to_dataset()for details- var_names: str or list of str, optional
One or more variables to be plotted. Prefix the variables by
~when you want to exclude them from the plot.- filter_vars: {None, “like”, “regex”}, optional, default=None
If None (default), interpret var_names as the real variables names. If “like”, interpret var_names as substrings of the real variables names. If “regex”, interpret var_names as regular expressions on the real variables names. A la
pandas.filter.- coords: dict of {str: slice or array_like}, optional
Coordinates of var_names to be plotted. Passed to
xarray.Dataset.sel()- divergences: {“bottom”, “top”, None}, optional
Plot location of divergences on the traceplots.
- kind: {“trace”, “rank_bars”, “rank_vlines”}, optional
Choose between plotting sampled values per iteration and rank plots.
- transform: callable, optional
Function to transform data (defaults to None i.e.the identity function)
- figsize: tuple of (float, float), optional
If None, size is (12, variables * 2)
- rug: bool, optional
If True adds a rugplot of samples. Defaults to False. Ignored for 2D KDE. Only affects continuous variables.
- lines: list of tuple of (str, dict, array_like), optional
List of (var_name, {‘coord’: selection}, [line, positions]) to be overplotted as vertical lines on the density and horizontal lines on the trace.
- circ_var_namesstr or list of str, optional
List of circular variables to account for when plotting KDE.
- circ_var_unitsstr
Whether the variables in
circ_var_namesare in “degrees” or “radians”.- compact: bool, optional
Plot multidimensional variables in a single plot.
- compact_prop: str or dict {str: array_like}, optional
Tuple containing the property name and the property values to distinguish different dimensions with compact=True
- combined: bool, optional
Flag for combining multiple chains into a single line. If False (default), chains will be plotted separately.
- chain_prop: str or dict {str: array_like}, optional
Tuple containing the property name and the property values to distinguish different chains
- legend: bool, optional
Add a legend to the figure with the chain color code.
- plot_kwargs, fill_kwargs, rug_kwargs, hist_kwargs: dict, optional
Extra keyword arguments passed to
arviz.plot_dist(). Only affects continuous variables.- trace_kwargs: dict, optional
Extra keyword arguments passed to
matplotlib.axes.Axes.plot()- labellerlabeller instance, optional
Class providing the method
make_label_vertto generate the labels in the plot titles. Read the Label guide for more details and usage examples.- rank_kwargsdict, optional
Extra keyword arguments passed to
arviz.plot_rank()- axes: axes, optional
Matplotlib axes or bokeh figures.
- backend: {“matplotlib”, “bokeh”}, optional
Select plotting backend.
- backend_config: dict, optional
Currently specifies the bounds to use for bokeh axes. Defaults to value set in rcParams.
- backend_kwargs: dict, optional
These are kwargs specific to the backend being used, passed to
matplotlib.pyplot.subplots()orbokeh.plotting.figure().- show: bool, optional
Call backend show function.
- Returns
- axes: matplotlib axes or bokeh figures
See also
plot_rankPlot rank order statistics of chains.
Examples
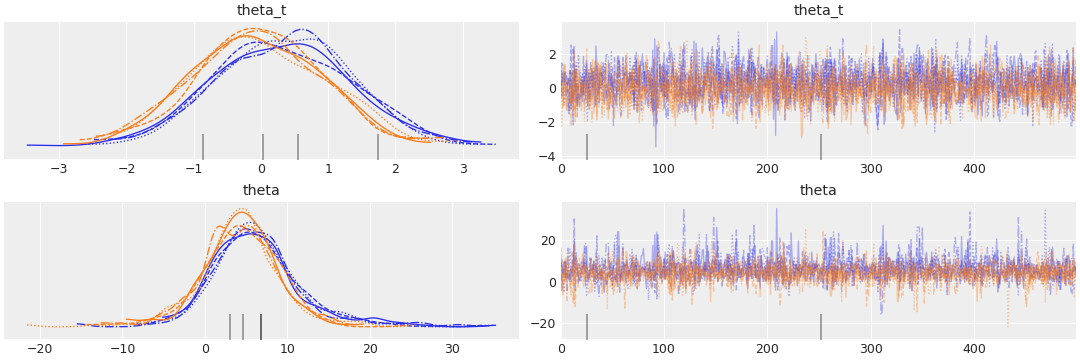
Plot a subset variables and select them with partial naming
>>> import arviz as az
>>> data = az.load_arviz_data('non_centered_eight')
>>> coords = {'school': ['Choate', 'Lawrenceville']}
>>> az.plot_trace(data, var_names=('theta'), filter_vars="like", coords=coords)
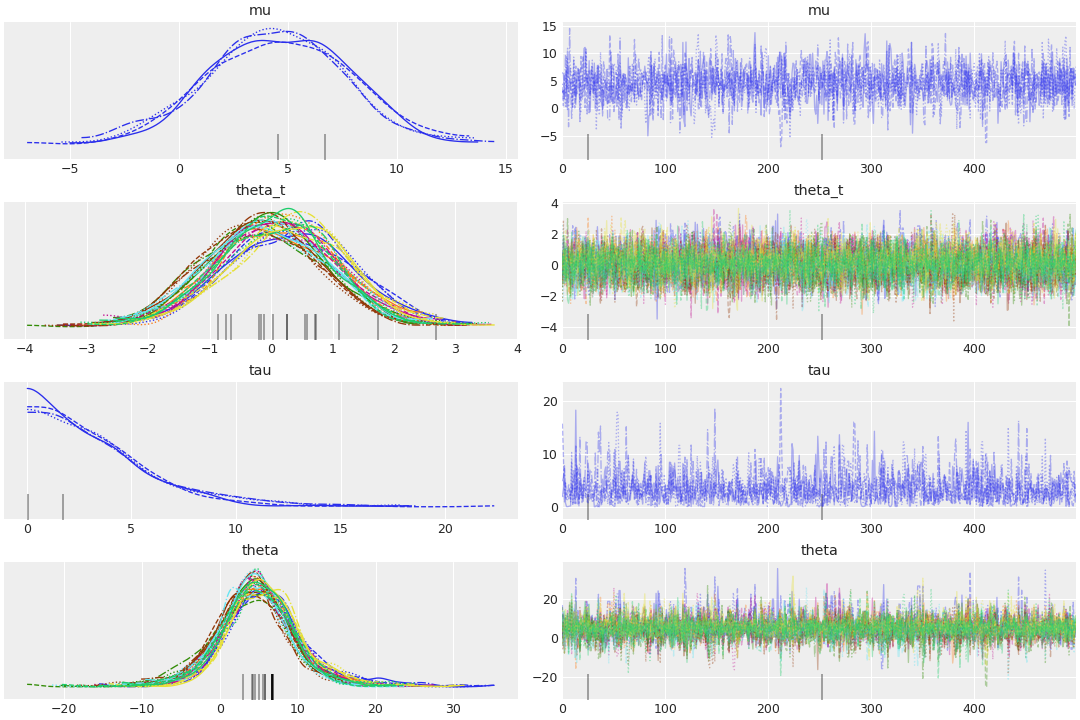
Show all dimensions of multidimensional variables in the same plot
>>> az.plot_trace(data, compact=True)
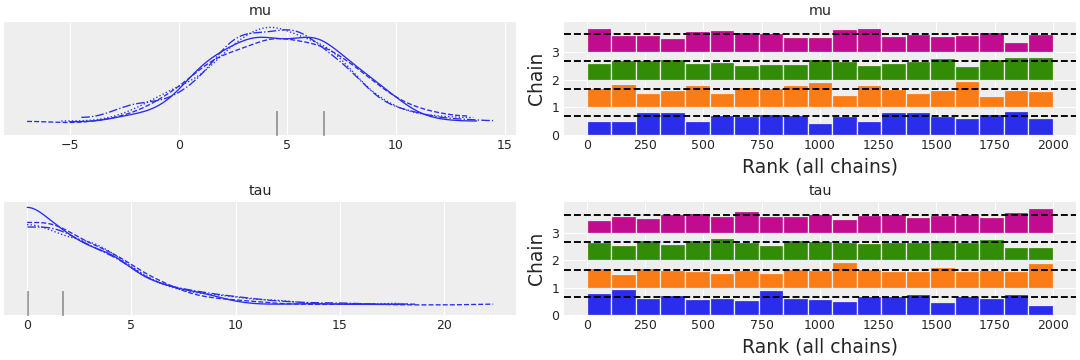
Display a rank plot instead of trace
>>> az.plot_trace(data, var_names=["mu", "tau"], kind="rank_bars")
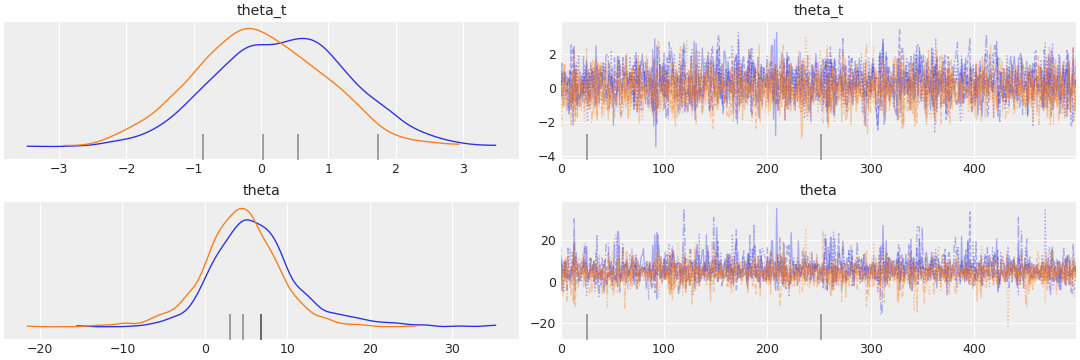
Combine all chains into one distribution and select variables with regular expressions
>>> az.plot_trace(
>>>     data, var_names=('^theta'), filter_vars="regex", coords=coords, combined=True
>>> )
Plot reference lines against distribution and trace
>>> lines = (('theta_t',{'school': "Choate"}, [-1]),)
>>> az.plot_trace(data, var_names=('theta_t', 'theta'), coords=coords, lines=lines)
