arviz.plot_khat#
- arviz.plot_khat(khats, color='C0', xlabels=False, show_hlines=False, show_bins=False, bin_format='{1:.1f}%', annotate=False, threshold=None, hover_label=False, hover_format='{1}', figsize=None, textsize=None, coords=None, legend=False, markersize=None, ax=None, hlines_kwargs=None, backend=None, backend_kwargs=None, show=None, **kwargs)[source]#
Plot Pareto tail indices for diagnosing convergence.
- Parameters
- khatsELPDData containing Pareto shapes information or array of
Pareto tail indices.
- colorstr or array_like, optional
Colors of the scatter plot, if color is a str all dots will have the same color, if it is the size of the observations, each dot will have the specified color, otherwise, it will be interpreted as a list of the dims to be used for the color code. If Matplotlib c argument is passed, it will override the color argument
- xlabelsbool, optional
Use coords as xticklabels
- show_hlinesbool, optional
Show the horizontal lines, by default at the values [0, 0.5, 0.7, 1].
- show_binsbool, optional
Show the percentage of khats falling in each bin, as delimited by hlines.
- bin_formatstr, optional
The string is used as formatting guide calling
bin_format.format(count, pct).- thresholdfloat, optional
Show the labels of k values larger than threshold. Defaults to None, no observations will be highlighted.
- hover_labelbool, optional
Show the datapoint label when hovering over it with the mouse. Requires an interactive backend.
- hover_formatstr, optional
String used to format the hover label via
hover_format.format(idx, coord_label)- figsizetuple, optional
Figure size. If None it will be defined automatically.
- textsize: float, optional
Text size scaling factor for labels, titles and lines. If None it will be autoscaled based on figsize.
- coordsmapping, optional
Coordinates of points to plot. All values are used for computation, but only a a subset can be plotted for convenience.
- legendbool, optional
Include a legend to the plot. Only taken into account when color argument is a dim name.
- markersize: int, optional
markersize for scatter plot. Defaults to None in which case it will be chosen based on autoscaling for figsize.
- ax: axes, optional
Matplotlib axes or bokeh figures.
- hlines_kwargs: dictionary, optional
Additional keywords passed to
matplotlib.axes.Axes.hlines().- backend: str, optional
Select plotting backend {“matplotlib”,”bokeh”}. Default “matplotlib”.
- backend_kwargs: bool, optional
These are kwargs specific to the backend being used, passed to
matplotlib.pyplot.subplots()orbokeh.plotting.figure().- showbool, optional
Call backend show function.
- kwargs
Additional keywords passed to
matplotlib.axes.Axes.scatter().
- Returns
- axesmatplotlib axes or bokeh figures
See also
psislwPareto smoothed importance sampling (PSIS).
Notes
The Generalized Pareto distribution (GPD) may be used to diagnose convergence rates for importance sampling. GPD has parameters offset, scale, and shape. The shape parameter is usually denoted with
k.kalso tells how many finite moments the distribution has. The pre-asymptotic convergence rate of importance sampling can be estimated based on the fractional number of finite moments of the importance ratio distribution. GPD is fitted to the largest importance ratios and the estimated shape parameterk, i.e.,\hat{k}can then be used as a diagnostic (most importantly if\hat{k} > 0.7, then the convergence rate is impractically low). See [1].References
- 1
Vehtari, A., Simpson, D., Gelman, A., Yao, Y., Gabry, J.,
Pareto Smoothed Importance Sampling. arXiv:1507.02646 [stat].
Examples
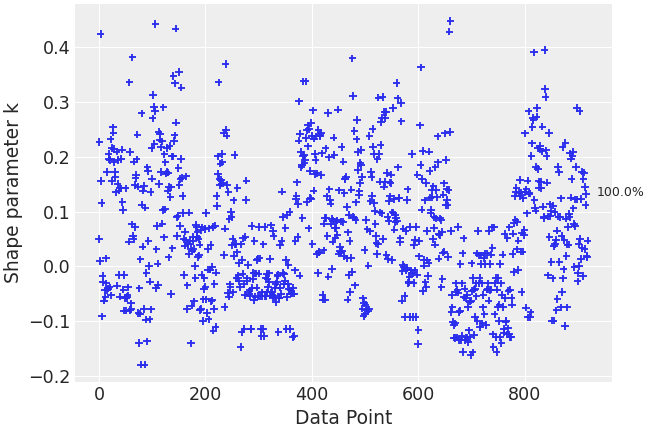
Plot estimated pareto shape parameters showing how many fall in each category.
>>> import arviz as az
>>> radon = az.load_arviz_data("radon")
>>> loo_radon = az.loo(radon, pointwise=True)
>>> az.plot_khat(loo_radon, show_bins=True)
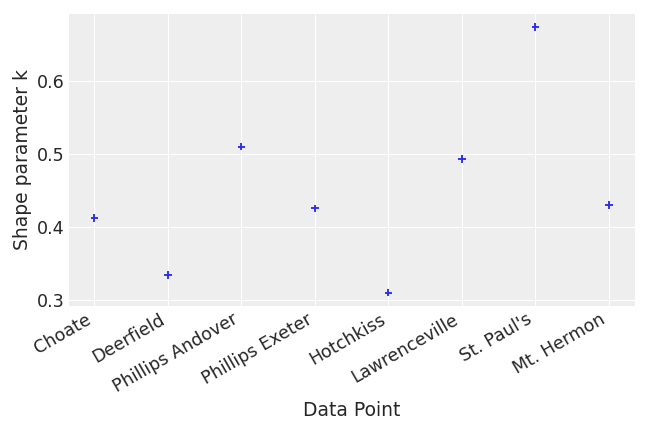
Show xlabels
>>> centered_eight = az.load_arviz_data("centered_eight")
>>> khats = az.loo(centered_eight, pointwise=True).pareto_k
>>> az.plot_khat(khats, xlabels=True, threshold=1)
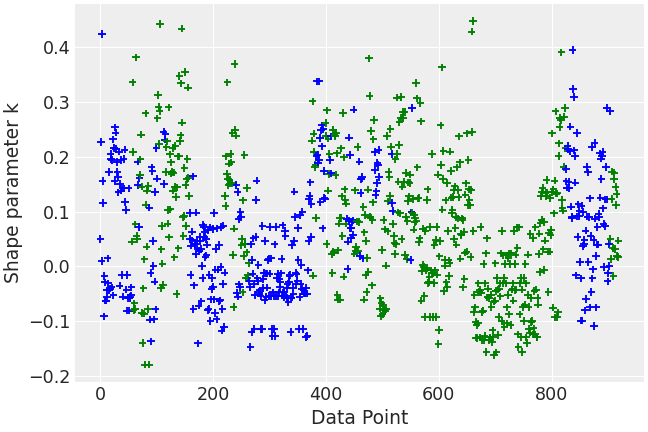
Use custom color scheme
>>> counties = radon.posterior.County[radon.constant_data.county_idx].values
>>> colors = [
...     "blue" if county[-1] in ("A", "N") else "green" for county in counties
... ]
>>> az.plot_khat(loo_radon, color=colors)