arviz.plot_elpd#
- arviz.plot_elpd(compare_dict, color='C0', xlabels=False, figsize=None, textsize=None, coords=None, legend=False, threshold=None, ax=None, ic=None, scale=None, var_name=None, plot_kwargs=None, backend=None, backend_kwargs=None, show=None)[source]#
Plot pointwise elpd differences between two or more models.
- Parameters
- compare_dictmapping of {strELPDData or InferenceData}
A dictionary mapping the model name to the object containing inference data or the result of
arviz.loo()orarviz.waic()functions. Refer toarviz.convert_to_inference_data()for details on possible dict items.- colorstr or array_like, optional
Colors of the scatter plot. If color is a str all dots will have the same color. If it is the size of the observations, each dot will have the specified color. Otherwise, it will be interpreted as a list of the dims to be used for the color code.
- xlabelsbool, optional
Use coords as xticklabels. Defaults to False.
- figsizefigure size tuple, optional
If None, size is (8 + numvars, 8 + numvars).
- textsize: int, optional
Text size for labels. If None it will be autoscaled based on
figsize.- coordsmapping, optional
Coordinates of points to plot. All values are used for computation, but only a subset can be plotted for convenience.
- legendbool, optional
Include a legend to the plot. Only taken into account when color argument is a dim name.
- thresholdfloat
If some elpd difference is larger than
threshold * elpd.std(), show its label. If None, no observations will be highlighted.- icstr, optional
Information Criterion (“loo” for PSIS-LOO, “waic” for WAIC) used to compare models. Defaults to
rcParams["stats.information_criterion"]. Only taken into account when input isarviz.InferenceData.- scalestr, optional
Scale argument passed to
arviz.loo()orarviz.waic(), see their docs for details. Only taken into account when values incompare_dictarearviz.InferenceData.- var_namestr, optional
Argument passed to to
arviz.loo()orarviz.waic(), see their docs for details. Only taken into account when values incompare_dictarearviz.InferenceData.- plot_kwargsdicts, optional
Additional keywords passed to
matplotlib.axes.Axes.scatter().- ax: axes, optional
- backend: str, optional
Select plotting backend {“matplotlib”, “bokeh”}. Defaults to “matplotlib”.
- backend_kwargs: bool, optional
These are kwargs specific to the backend being used, passed to
matplotlib.pyplot.subplots()orbokeh.plotting.figure().- showbool, optional
Call backend show function.
- Returns
- axesmatplotlib axes or bokeh figures
See also
plot_compareSummary plot for model comparison.
Examples
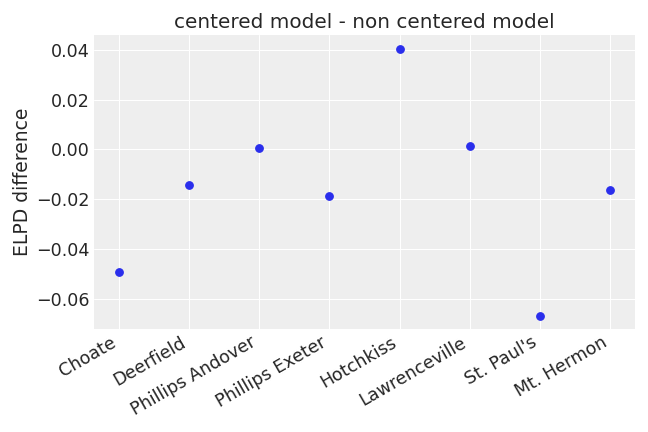
Compare pointwise PSIS-LOO for centered and non centered models of the 8-schools problem using matplotlib.
>>> import arviz as az
>>> idata1 = az.load_arviz_data("centered_eight")
>>> idata2 = az.load_arviz_data("non_centered_eight")
>>> az.plot_elpd(
>>>     {"centered model": idata1, "non centered model": idata2},
>>>     xlabels=True
>>> )
import arviz as az
idata1 = az.load_arviz_data("centered_eight")
idata2 = az.load_arviz_data("non_centered_eight")
az.plot_elpd(
    {"centered model": idata1, "non centered model": idata2},
    backend="bokeh"
)