arviz.plot_parallel
-
arviz.plot_parallel(data, var_names=None, filter_vars=None, coords=None, figsize=None, textsize=None, legend=True, colornd='k', colord='C1', shadend=0.025, labeller=None, ax=None, norm_method=None, backend=None, backend_config=None, backend_kwargs=None, show=None)[source]¶ Plot parallel coordinates plot showing posterior points with and without divergences.
Described by https://arxiv.org/abs/1709.01449
- Parameters
- data: obj
Any object that can be converted to an az.InferenceData object Refer to documentation of az.convert_to_dataset for details
- var_names: list of variable names
Variables to be plotted, if None all variable are plotted. Can be used to change the order of the plotted variables. Prefix the variables by ~ when you want to exclude them from the plot.
- filter_vars: {None, “like”, “regex”}, optional, default=None
If None (default), interpret var_names as the real variables names. If “like”, interpret var_names as substrings of the real variables names. If “regex”, interpret var_names as regular expressions on the real variables names. A la pandas.filter.
- coords: mapping, optional
Coordinates of var_names to be plotted. Passed to Dataset.sel
- figsize: tuple
Figure size. If None it will be defined automatically.
- textsize: float
Text size scaling factor for labels, titles and lines. If None it will be autoscaled based on figsize.
- legend: bool
Flag for plotting legend (defaults to True)
- colornd: valid matplotlib color
color for non-divergent points. Defaults to ‘k’
- colord: valid matplotlib color
color for divergent points. Defaults to ‘C1’
- shadend: float
Alpha blending value for non-divergent points, between 0 (invisible) and 1 (opaque). Defaults to .025
- labellerlabeller instance, optional
Class providing the method make_label_vert to generate the labels in the plot. Read the Label guide for more details and usage examples.
- ax: axes, optional
Matplotlib axes or bokeh figures.
- norm_method: str
Method for normalizing the data. Methods include normal, minmax and rank. Defaults to none.
- backend: str, optional
Select plotting backend {“matplotlib”,”bokeh”}. Default “matplotlib”.
- backend_config: dict, optional
Currently specifies the bounds to use for bokeh axes. Defaults to value set in rcParams.
- backend_kwargs: bool, optional
These are kwargs specific to the backend being used. For additional documentation check the plotting method of the backend.
- show: bool, optional
Call backend show function.
- Returns
- axes: matplotlib axes or bokeh figures
Examples
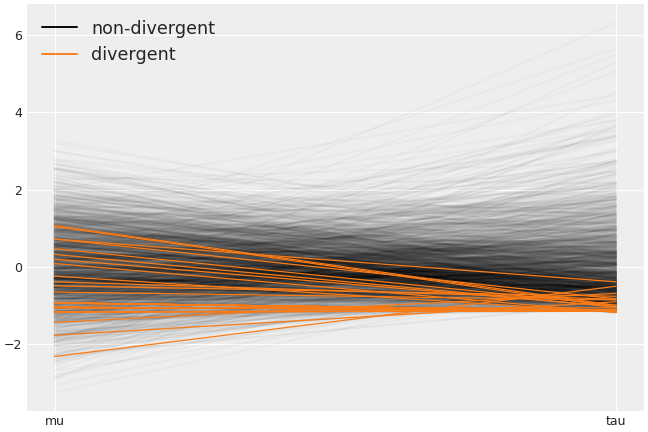
Plot default parallel plot
>>> import arviz as az
>>> data = az.load_arviz_data('centered_eight')
>>> az.plot_parallel(data, var_names=["mu", "tau"])
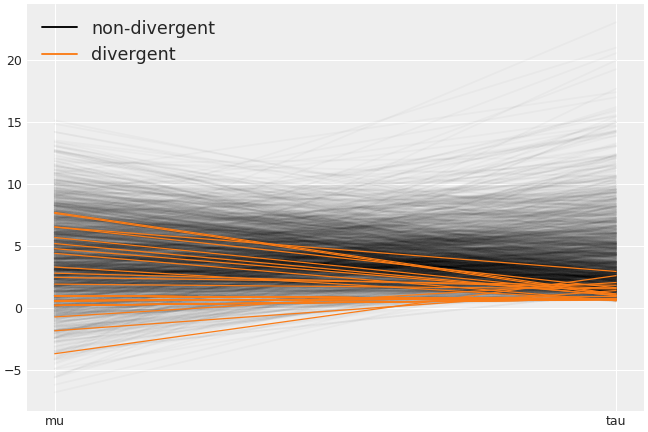
Plot parallel plot with normalization
>>> az.plot_parallel(data, var_names=["mu", "tau"], norm_method='normal')