arviz_plots.plot_rank#
- arviz_plots.plot_rank(dt, *, var_names=None, filter_vars=None, group='posterior', coords=None, sample_dims=None, envelope_prob=None, method='mtc_c', thin=None, plot_collection=None, backend=None, labeller=None, aes_by_visuals=None, visuals=None, stats=None, **pc_kwargs)[source]#
Fractional rank Δ-ECDF plots.
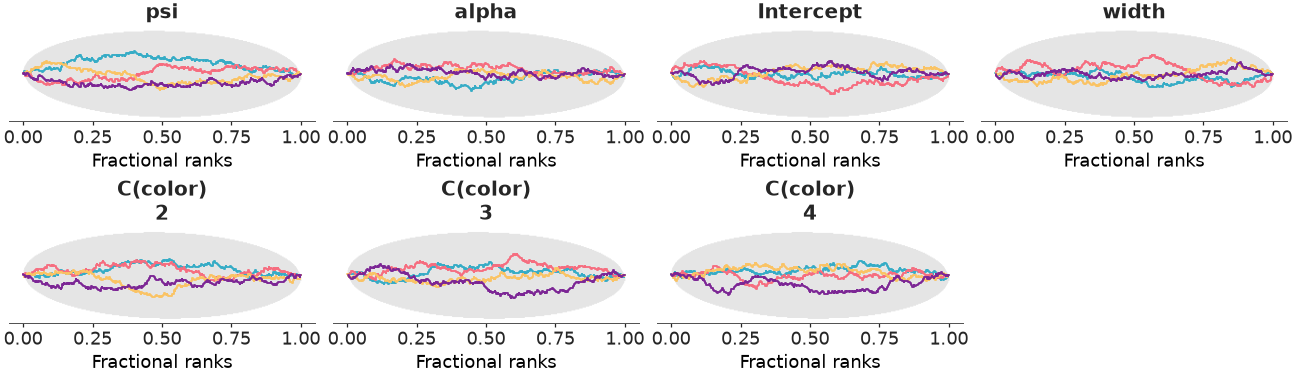
Rank plots are built by replacing the posterior draws by their ranking computed over all chains. Then each chain is plotted independently. If all of the chains are targeting the same posterior, we expect the ranks in each chain to be uniformly distributed. To simplify comparison we compute the ordered fractional ranks, which are distributed uniformly in [0, 1]. Additionally, we plot the Δ-ECDF, that is, the difference between the expected CDF from the observed ECDF.
The points that contribute the most to deviations from uniformity are computed as described in [1].
- Parameters:
- dt
xarray.DataTree Input data
- var_names
strorlistofstr, optional One or more variables to be plotted. Currently only one variable is supported. Prefix the variables by ~ when you want to exclude them from the plot.
- filter_vars{
None, “like”, “regex”}, optional, default=None If None (default), interpret var_names as the real variables names. If “like”, interpret var_names as substrings of the real variables names. If “regex”, interpret var_names as regular expressions on the real variables names.
- group
str, optional Which group to use. Defaults to “posterior”.
- coords
dict, optional Coordinates to plot.
- sample_dims
stror sequence of hashable, optional Dimensions to reduce unless mapped to an aesthetic. Defaults to
rcParams["data.sample_dims"]- envelope_prob
float, optional Indicates the probability that should be contained within the envelope. Defaults to
rcParams["stats.envelope_prob"].- method{“mtc_c”, “envelope”}, default “mtc_c”
Method to use for the rank plot. If “mtc_c”, the multi-chain test is performed and suspicious points are highlighted. If “envelope”, the envelope is computed and plotted.
- thinbool, default
None Whether to thin the data before plotting. Defaults to None, which means that it is set to True if “method” is “envelope” and False otherwise.
- plot_collection
PlotCollection, optional - backend{“matplotlib”, “bokeh”, “plotly”}, optional
- labeller
labeller, optional - aes_by_visualsmapping of {
strsequence ofstr}, optional Mapping of visuals to aesthetics that should use their mapping in
plot_collectionwhen plotted. Valid keys are the same as forvisuals.- visualsmapping of {
strmapping or bool}, optional Valid keys are:
ecdf_lines -> passed to
ecdf_linecredible_interval -> passed to
fill_between_yxlabel -> passed to
labelled_xtitle -> passed to
labelled_titleremove_axis -> not passed anywhere, can only be
Falseto skip calling this function
- statsmapping, optional
Valid keys are:
ecdf_pit -> passed to
ecdf_pit. Default is{"n_simulations": 1000}.mtc_c -> passed to
mchain_uniformity_test.thin -> passed to
thin
- **pc_kwargs
Passed to
arviz_plots.PlotCollection.wrap
- dt
- Returns:
Notes
The preferred method is mtc_c as it takes into account the autocorrelation in the rank values as described in [1]. The “envelope” method is not longer recommended and it will likely be removed in a future release.
References
[2]Säilynoja et al. Graphical test for discrete uniformity and its applications in goodness-of-fit evaluation and multiple sample comparison. Statistics and Computing 32(32). (2022) https://doi.org/10.1007/s11222-022-10090-6
Examples
Rank plot for the crabs hurdle-negative-binomial dataset.
>>> from arviz_plots import plot_rank, style
>>> style.use("arviz-variat")
>>> from arviz_base import load_arviz_data
>>> dt = load_arviz_data('crabs_hurdle_nb')
>>> plot_rank(dt, var_names=["~mu"])