arviz_plots.plot_ppc_dist_pit#
- arviz_plots.plot_ppc_dist_pit(dt, *, var_names=None, filter_vars=None, group='posterior_predictive', coords=None, sample_dims=None, kind=None, num_samples=50, method='pot_c', envelope_prob=None, coverage=False, plot_collection=None, backend=None, labeller=None, aes_by_visuals=None, visuals=None, stats=None, **pc_kwargs)[source]#
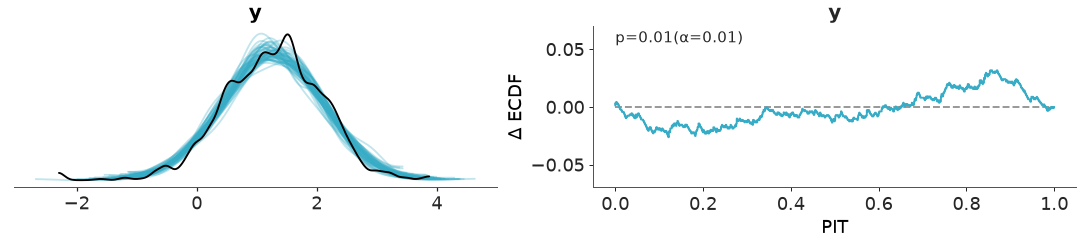
1D marginals for the predictive distribution and PIT Δ-ECDF.
The left column shows 1D marginals for the posterior predictive distribution overlaid on the observed data, identical to
plot_ppc_dist.The right column shows the empirical CDF (ECDF) of the PIT values minus the expected CDF, identical to
plot_ppc_pit.Suspicious observations are computed from the uniformity test and they are highlighted in both columns, either as rug marks at y=0 in the dist column or as points in ECDF for the PIT column. The suspicious observations are the ones that contribute the most to deviations from uniformity.
- Parameters:
- dt
xarray.DataTree Input data with
posterior_predictiveandobserved_datagroups.- var_names
strorlistofstr, optional Variables to plot.
- filter_vars{
None, “like”, “regex”}, optional - groupstr,
Group to be plotted. Defaults to “posterior_predictive”. It could also be “prior_predictive”.
- coords
dict, optional - sample_dims
stror sequence of hashable, optional Defaults to
rcParams["data.sample_dims"].- kind{“auto”, “kde”, “hist”, “ecdf”, “dot”}, optional
Density kind for the dist column. Defaults to
rcParams["plot.density_kind"].- num_samples
int, default 50 Number of predictive draws to overlay in the dist column.
- method{“pot_c”, “prit_c”, “piet_c”, “envelope”}, default “pot_c”
Uniformity-test method for the PIT column.
- envelope_prob
float, optional Probability inside the simultaneous envelope. Defaults to
rcParams["stats.envelope_prob"].- coveragebool, default
False If True, replace PIT with
2|PIT - 0.5|to assess ETI coverage.- plot_collection
PlotCollection, optional - backend{“matplotlib”, “bokeh”, “plotly”}, optional
- labeller
labeller, optional - aes_by_visualsmapping, optional
Valid keys:
predictive_dist,observed_dist,ecdf_lines,credible_interval,suspicious_points,p_value_text,title.- visualsmapping, optional
Valid keys:
predictive_dist -> density lines for predictive draws
observed_dist -> density line for observed data
ecdf_lines -> passed to
ecdf_linecredible_interval -> only when
method="envelope"suspicious_points -> passed to
scatter_xyp_value_text -> passed to
annotate_xyxlabel_dist -> x-axis label for the dist column
xlabel_pit -> x-axis label for the PIT column
ylabel -> y-axis label for the PIT column
title -> passed to
labelled_titleremove_axis -> set to
Falseto skip axis removal
- statsmapping, optional
Valid keys:
predictive_dist,observed_dist,ecdf_pit.- **pc_kwargs
Passed to
grid.
- dt
- Returns:
See also
plot_ppc_distPredictive density check only.
plot_ppc_pitPIT Δ-ECDF check only.
Examples
>>> from arviz_plots import plot_ppc_dist_pit, style
>>> style.use("arviz-variat")
>>> from arviz_base import load_arviz_data
>>> dt = load_arviz_data('radon')
>>> plot_ppc_dist_pit(dt)