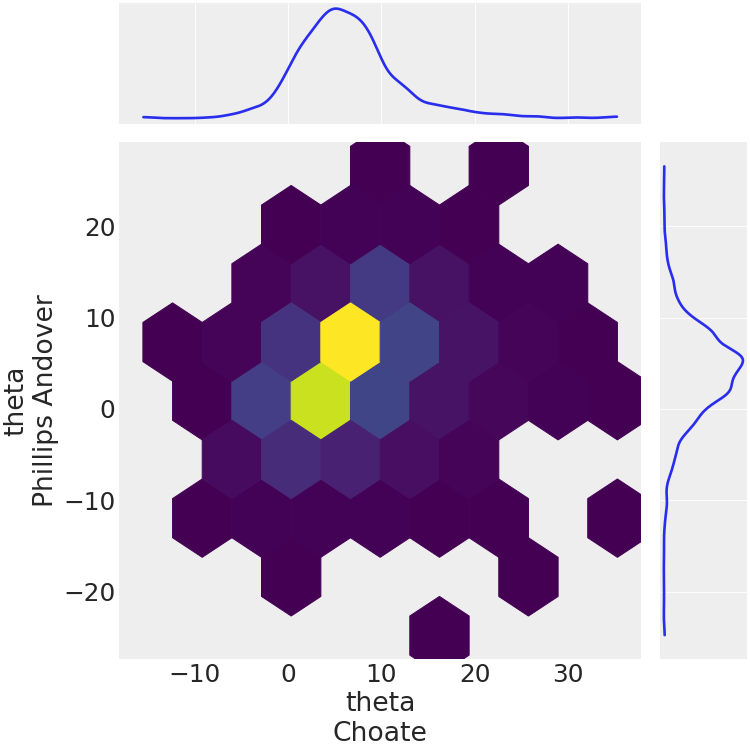
Joint Plot
API documentation: plot_pair()
Python source code: [download source: matplotlib/mpl_plot_joint.py]
import matplotlib.pyplot as plt

import arviz as az

az.style.use("arviz-darkgrid")


data = az.load_arviz_data("non_centered_eight")

az.plot_pair(
    data,
    var_names=["theta"],
    coords={"school": ["Choate", "Phillips Andover"]},
    kind="hexbin",
    marginals=True,
    figsize=(10, 10),
)
plt.show()
Python source code: [download source: bokeh/bokeh_plot_joint.py]
import arviz as az

data = az.load_arviz_data("non_centered_eight")

ax = az.plot_pair(
    data,
    var_names=["theta"],
    coords={"school": ["Choate", "Phillips Andover"]},
    kind="hexbin",
    figsize=(8, 8),
    marginals=True,
    marginal_kwargs={"plot_kwargs": {"line_width": 3, "line_color": "black"}},
    hexbin_kwargs={"size": 1.5},
    backend="bokeh",
)