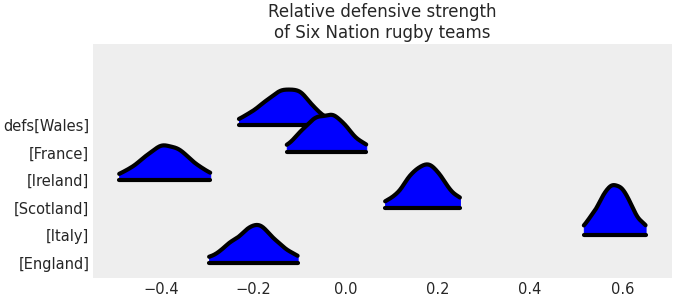
Ridgeplot
API documentation: plot_forest()
Python source code: [download source: matplotlib/mpl_plot_forest_ridge.py]
import matplotlib.pyplot as plt

import arviz as az

az.style.use("arviz-darkgrid")

rugby_data = az.load_arviz_data("rugby")
axes = az.plot_forest(
    rugby_data,
    kind="ridgeplot",
    var_names=["defs"],
    linewidth=4,
    combined=True,
    ridgeplot_overlap=1.5,
    colors="blue",
    figsize=(9, 4),
)
axes[0].set_title("Relative defensive strength\nof Six Nation rugby teams")

plt.show()
Python source code: [download source: bokeh/bokeh_plot_forest_ridge.py]
import arviz as az

rugby_data = az.load_arviz_data("rugby")
ax = az.plot_forest(
    rugby_data,
    kind="ridgeplot",
    var_names=["defs"],
    linewidth=4,
    combined=True,
    ridgeplot_overlap=1.5,
    colors="blue",
    figsize=(9, 4),
    backend="bokeh",
)