Converting emcee objects to InferenceData#
InferenceData is the central data format for ArviZ. InferenceData itself is just a container that maintains references to one or more xarray.Dataset.
Below are various ways to generate an InferenceData from emcee objects.
See also
Conversion from Python, numpy or pandas objects
Introduction to xarray, InferenceData, and netCDF for ArviZ for an overview of
InferenceDataand its role within ArviZ.InferenceData schema specification describes the structure of
InferenceDataobjects and the assumptions made by ArviZ to ease your exploratory analysis of Bayesian models.
We will start by importing the required packages and defining the model. The famous 8 school model.
import arviz as az
import numpy as np
import emcee
az.style.use("arviz-darkgrid")
def log_prior_8school(theta):
    mu, tau, eta = theta[0], theta[1], theta[2:]
    # Half-cauchy prior, hwhm=25
    if tau < 0:
        return -np.inf
    prior_tau = -np.log(tau**2 + 25**2)
    prior_mu = -((mu / 10) ** 2)  # normal prior, loc=0, scale=10
    prior_eta = -np.sum(eta**2)  # normal prior, loc=0, scale=1
    return prior_mu + prior_tau + prior_eta


def log_likelihood_8school(theta, y, s):
    mu, tau, eta = theta[0], theta[1], theta[2:]
    return -(((mu + tau * eta - y) / s) ** 2)


def lnprob_8school(theta, y, s):
    prior = log_prior_8school(theta)
    like_vect = log_likelihood_8school(theta, y, s)
    like = np.sum(like_vect)
    return like + prior
nwalkers = 40  # called chains in ArviZ
ndim = J + 2
draws = 1500
pos = np.random.normal(size=(nwalkers, ndim))
pos[:, 1] = np.absolute(pos[:, 1])
sampler = emcee.EnsembleSampler(nwalkers, ndim, lnprob_8school, args=(y_obs, sigma))
sampler.run_mcmc(pos, draws);
Manually set variable names#
This first example will show how to convert manually setting the variable names only, leaving everything else to ArviZ defaults.
# define variable names, it cannot be inferred from emcee
var_names = ["mu", "tau"] + ["eta{}".format(i) for i in range(J)]
idata1 = az.from_emcee(sampler, var_names=var_names)
idata1
-
- chain: 40
- draw: 1500
- chain(chain)int640 1 2 3 4 5 6 ... 34 35 36 37 38 39
array([ 0, 1, 2, 3, 4, 5, 6, 7, 8, 9, 10, 11, 12, 13, 14, 15, 16, 17, 18, 19, 20, 21, 22, 23, 24, 25, 26, 27, 28, 29, 30, 31, 32, 33, 34, 35, 36, 37, 38, 39]) - draw(draw)int640 1 2 3 4 ... 1496 1497 1498 1499
array([ 0, 1, 2, ..., 1497, 1498, 1499])
- mu(chain, draw)float640.6982 0.7962 ... 5.763 5.029
array([[ 0.69824844, 0.79617544, 0.84330726, ..., 5.36725902, 5.36725902, 5.36725902], [ 0.11248859, 0.11248859, 0.06015108, ..., 6.26414247, 7.48213444, 7.62666694], [-0.93632231, -0.93632231, -0.88874485, ..., 2.07279112, 2.07279112, 2.07279112], ..., [-1.39513971, -0.6841303 , -0.22676674, ..., 8.03948904, 8.03948904, 8.03948904], [-0.64258473, -0.63895969, -0.27810694, ..., 1.28046414, -0.03145993, -0.03145993], [-1.51237728, -1.51237728, -1.51237728, ..., 5.76290275, 5.76290275, 5.02928256]]) - tau(chain, draw)float640.6679 0.7259 ... 2.051 3.239
array([[ 0.66788403, 0.7259102 , 0.80752206, ..., 0.03694788, 0.03694788, 0.03694788], [ 0.3207948 , 0.3207948 , 0.41749554, ..., 9.79903119, 8.14156878, 7.60103129], [ 1.04038851, 1.04038851, 1.06008197, ..., 17.27429606, 17.27429606, 17.27429606], ..., [ 1.33245704, 1.06653867, 1.02533509, ..., 0.22325512, 0.22325512, 0.22325512], [ 0.53704382, 0.49084296, 0.82428818, ..., 0.97799322, 0.71121769, 0.71121769], [ 1.03024648, 1.03024648, 1.03024648, ..., 2.05085976, 2.05085976, 3.23924793]]) - eta0(chain, draw)float640.08153 0.008519 ... 0.4684 0.6057
array([[ 0.08152575, 0.00851919, 0.00771088, ..., 0.01908609, 0.01908609, 0.01908609], [ 0.51822161, 0.51822161, 0.52702754, ..., 0.77482336, 1.00139478, 1.01300919], [ 1.96407299, 1.96407299, 1.82762146, ..., 0.81201598, 0.81201598, 0.81201598], ..., [ 0.54905919, -0.30758132, -0.15850033, ..., 0.71909529, 0.71909529, 0.71909529], [-1.49816062, -1.60204414, -1.26912917, ..., -0.63261196, -0.78396615, -0.78396615], [-0.40230539, -0.40230539, -0.40230539, ..., 0.46842652, 0.46842652, 0.60565958]]) - eta1(chain, draw)float64-0.5837 -0.6358 ... 1.431 1.608
array([[-0.58367651, -0.63579839, -0.82795929, ..., -0.33392221, -0.33392221, -0.33392221], [-0.27190443, -0.27190443, -0.82228464, ..., 0.36996327, 0.63805827, 0.42878518], [ 0.7449581 , 0.7449581 , 0.72617796, ..., 0.41748271, 0.41748271, 0.41748271], ..., [ 1.02197852, 0.96290899, 0.60247571, ..., 1.04108037, 1.04108037, 1.04108037], [ 0.34551004, 0.29163914, -0.10763165, ..., -0.32320034, -0.38804561, -0.38804561], [-0.34432128, -0.34432128, -0.34432128, ..., 1.43086564, 1.43086564, 1.60761732]]) - eta2(chain, draw)float640.104 -0.003427 ... -1.056 -0.8344
array([[ 0.10398099, -0.00342714, 0.08644913, ..., 0.3755985 , 0.3755985 , 0.3755985 ], [ 0.7464532 , 0.7464532 , 0.37312608, ..., -0.70063911, -0.71519927, -0.81143714], [-0.32280405, -0.32280405, -0.31178929, ..., -0.51019 , -0.51019 , -0.51019 ], ..., [-0.45466237, -0.05838037, 0.03900794, ..., -0.21620162, -0.21620162, -0.21620162], [-2.04671119, -2.2202022 , -1.19514007, ..., 1.33819298, 1.50462748, 1.50462748], [-0.9050526 , -0.9050526 , -0.9050526 , ..., -1.05638496, -1.05638496, -0.83442841]]) - eta3(chain, draw)float640.8693 1.196 ... -1.621 -0.8859
array([[ 0.8693095 , 1.19621798, 1.42303564, ..., -0.79560144, -0.79560144, -0.79560144], [-1.08612533, -1.08612533, -0.54359142, ..., 0.90278086, 1.15766589, 0.7120672 ], [ 1.39504785, 1.39504785, 1.31201871, ..., 0.22067313, 0.22067313, 0.22067313], ..., [-1.87925062, -0.21780186, -0.11415233, ..., 0.83981125, 0.83981125, 0.83981125], [ 1.20783543, 1.33222884, 1.14406311, ..., -0.01284912, -0.08905337, -0.08905337], [ 0.37776041, 0.37776041, 0.37776041, ..., -1.62086036, -1.62086036, -0.88594592]]) - eta4(chain, draw)float640.8211 1.27 ... -1.509 -0.9923
array([[ 0.82105387, 1.26961709, 1.32416423, ..., -0.2459569 , -0.2459569 , -0.2459569 ], [-1.86207063, -1.86207063, -1.49599093, ..., 0.06620745, 0.14848399, -0.07355801], [ 1.28605108, 1.28605108, 1.25958692, ..., -0.60792979, -0.60792979, -0.60792979], ..., [-1.18420667, -0.71923738, -0.27185226, ..., 0.13602594, 0.13602594, 0.13602594], [ 0.0369629 , 0.10294485, 0.43936142, ..., -0.62330586, -0.63818442, -0.63818442], [-0.12814047, -0.12814047, -0.12814047, ..., -1.50864077, -1.50864077, -0.99230636]]) - eta5(chain, draw)float640.04491 0.2302 ... -0.8137 -0.5359
array([[ 0.04490954, 0.2302036 , 0.17352078, ..., 0.30174842, 0.30174842, 0.30174842], [-1.06344488, -1.06344488, -1.06039012, ..., -0.78676276, -1.00580536, -0.8994664 ], [-0.13577697, -0.13577697, -0.14314371, ..., 0.17122446, 0.17122446, 0.17122446], ..., [ 1.72646293, 0.49537014, 0.32919773, ..., -0.38252575, -0.38252575, -0.38252575], [-0.42622842, -0.50664213, 0.04164551, ..., -0.22083327, -0.23227815, -0.23227815], [ 0.00442761, 0.00442761, 0.00442761, ..., -0.81374118, -0.81374118, -0.53590256]]) - eta6(chain, draw)float640.2983 0.1357 ... -0.2085 0.0377
array([[ 0.29826293, 0.13570644, 0.1384578 , ..., 0.76155516, 0.76155516, 0.76155516], [ 1.27061036, 1.27061036, 0.71765789, ..., 0.42466312, 0.15725957, 0.05649381], [-0.45382172, -0.45382172, -0.40167441, ..., 0.42766215, 0.42766215, 0.42766215], ..., [ 0.24977824, -0.1289273 , 0.09393249, ..., -0.21744701, -0.21744701, -0.21744701], [ 0.19870891, 0.22729667, 0.85836095, ..., -0.15337504, -0.04459114, -0.04459114], [-0.1805794 , -0.1805794 , -0.1805794 , ..., -0.20851802, -0.20851802, 0.0377028 ]]) - eta7(chain, draw)float64-0.5895 -0.5165 ... 0.1594 -0.03057
array([[-0.58949077, -0.51653613, -0.60913273, ..., -0.28262954, -0.28262954, -0.28262954], [-1.02587602, -1.02587602, -1.18220311, ..., -0.70635198, -1.26786956, -0.87499378], [ 0.43803847, 0.43803847, 0.39577369, ..., -0.87502477, -0.87502477, -0.87502477], ..., [ 0.01571683, 0.7008197 , 0.67271331, ..., 0.51383304, 0.51383304, 0.51383304], [-1.20391145, -1.37010801, -1.05653758, ..., -0.8976637 , -0.91648287, -0.91648287], [ 1.80343844, 1.80343844, 1.80343844, ..., 0.15942518, 0.15942518, -0.03056562]])
- created_at :
- 2021-08-30T18:14:53.861857
- arviz_version :
- 0.11.2
- inference_library :
- emcee
- inference_library_version :
- 3.1.1
<xarray.Dataset>
Dimensions:  (chain: 40, draw: 1500)
Coordinates:
  * chain    (chain) int64 0 1 2 3 4 5 6 7 8 9 ... 30 31 32 33 34 35 36 37 38 39
  * draw     (draw) int64 0 1 2 3 4 5 6 7 ... 1493 1494 1495 1496 1497 1498 1499
Data variables:
    mu       (chain, draw) float64 0.6982 0.7962 0.8433 ... 5.763 5.763 5.029
    tau      (chain, draw) float64 0.6679 0.7259 0.8075 ... 2.051 2.051 3.239
    eta0     (chain, draw) float64 0.08153 0.008519 0.007711 ... 0.4684 0.6057
    eta1     (chain, draw) float64 -0.5837 -0.6358 -0.828 ... 1.431 1.431 1.608
    eta2     (chain, draw) float64 0.104 -0.003427 0.08645 ... -1.056 -0.8344
    eta3     (chain, draw) float64 0.8693 1.196 1.423 ... -1.621 -1.621 -0.8859
    eta4     (chain, draw) float64 0.8211 1.27 1.324 ... -1.509 -1.509 -0.9923
    eta5     (chain, draw) float64 0.04491 0.2302 0.1735 ... -0.8137 -0.5359
    eta6     (chain, draw) float64 0.2983 0.1357 0.1385 ... -0.2085 0.0377
    eta7     (chain, draw) float64 -0.5895 -0.5165 -0.6091 ... 0.1594 -0.03057
Attributes:
    created_at:                 2021-08-30T18:14:53.861857
    arviz_version:              0.11.2
    inference_library:          emcee
    inference_library_version:  3.1.1
xarray.Dataset -
- chain: 40
- draw: 1500
- chain(chain)int640 1 2 3 4 5 6 ... 34 35 36 37 38 39
array([ 0, 1, 2, 3, 4, 5, 6, 7, 8, 9, 10, 11, 12, 13, 14, 15, 16, 17, 18, 19, 20, 21, 22, 23, 24, 25, 26, 27, 28, 29, 30, 31, 32, 33, 34, 35, 36, 37, 38, 39]) - draw(draw)int640 1 2 3 4 ... 1496 1497 1498 1499
array([ 0, 1, 2, ..., 1497, 1498, 1499])
- lp(chain, draw)float64-16.3 -17.83 ... -20.11 -16.68
array([[-16.29703737, -17.82792262, -18.92214387, ..., -13.44930902, -13.44930902, -13.44930902], [-23.84232789, -23.84232789, -21.27484126, ..., -13.70035183, -17.53674728, -14.41060779], [-23.52855761, -23.52855761, -22.5780883 , ..., -13.55239988, -13.55239988, -13.55239988], ..., [-25.50638851, -17.64822888, -15.83134714, ..., -14.60346133, -14.60346133, -14.60346133], [-25.11716475, -26.98472303, -21.36045048, ..., -17.52355592, -19.35557577, -19.35557577], [-20.86324354, -20.86324354, -20.86324354, ..., -20.1093519 , -20.1093519 , -16.6765458 ]])
- created_at :
- 2021-08-30T18:14:53.851570
- arviz_version :
- 0.11.2
- inference_library :
- emcee
- inference_library_version :
- 3.1.1
<xarray.Dataset> Dimensions: (chain: 40, draw: 1500) Coordinates: * chain (chain) int64 0 1 2 3 4 5 6 7 8 9 ... 30 31 32 33 34 35 36 37 38 39 * draw (draw) int64 0 1 2 3 4 5 6 7 ... 1493 1494 1495 1496 1497 1498 1499 Data variables: lp (chain, draw) float64 -16.3 -17.83 -18.92 ... -20.11 -20.11 -16.68 Attributes: created_at: 2021-08-30T18:14:53.851570 arviz_version: 0.11.2 inference_library: emcee inference_library_version: 3.1.1xarray.Dataset -
- arg_0_dim_0: 8
- arg_1_dim_0: 8
- arg_0_dim_0(arg_0_dim_0)int640 1 2 3 4 5 6 7
array([0, 1, 2, 3, 4, 5, 6, 7])
- arg_1_dim_0(arg_1_dim_0)int640 1 2 3 4 5 6 7
array([0, 1, 2, 3, 4, 5, 6, 7])
- arg_0(arg_0_dim_0)float6428.0 8.0 -3.0 7.0 ... 1.0 18.0 12.0
array([28., 8., -3., 7., -1., 1., 18., 12.])
- arg_1(arg_1_dim_0)float6415.0 10.0 16.0 ... 11.0 10.0 18.0
array([15., 10., 16., 11., 9., 11., 10., 18.])
- created_at :
- 2021-08-30T18:14:53.853598
- arviz_version :
- 0.11.2
- inference_library :
- emcee
- inference_library_version :
- 3.1.1
<xarray.Dataset> Dimensions: (arg_0_dim_0: 8, arg_1_dim_0: 8) Coordinates: * arg_0_dim_0 (arg_0_dim_0) int64 0 1 2 3 4 5 6 7 * arg_1_dim_0 (arg_1_dim_0) int64 0 1 2 3 4 5 6 7 Data variables: arg_0 (arg_0_dim_0) float64 28.0 8.0 -3.0 7.0 -1.0 1.0 18.0 12.0 arg_1 (arg_1_dim_0) float64 15.0 10.0 16.0 11.0 9.0 11.0 10.0 18.0 Attributes: created_at: 2021-08-30T18:14:53.853598 arviz_version: 0.11.2 inference_library: emcee inference_library_version: 3.1.1xarray.Dataset
ArviZ has stored the posterior variables with the provided names as expected, but it has also included other useful information in the InferenceData object. The log probability of each sample is stored in the sample_stats group under the name lp and all the arguments passed to the sampler as args have been saved in the observed_data group.
It can also be useful to perform a burn in cut to the MCMC samples (see :meth:arviz.InferenceData.sel for more details)
idata1.sel(draw=slice(100, None))
-
- chain: 40
- draw: 1400
- chain(chain)int640 1 2 3 4 5 6 ... 34 35 36 37 38 39
array([ 0, 1, 2, 3, 4, 5, 6, 7, 8, 9, 10, 11, 12, 13, 14, 15, 16, 17, 18, 19, 20, 21, 22, 23, 24, 25, 26, 27, 28, 29, 30, 31, 32, 33, 34, 35, 36, 37, 38, 39]) - draw(draw)int64100 101 102 103 ... 1497 1498 1499
array([ 100, 101, 102, ..., 1497, 1498, 1499])
- mu(chain, draw)float646.588 6.588 6.588 ... 5.763 5.029
array([[ 6.5878517 , 6.5878517 , 6.5878517 , ..., 5.36725902, 5.36725902, 5.36725902], [ 8.78769258, 7.82575182, 7.82575182, ..., 6.26414247, 7.48213444, 7.62666694], [ 5.52583051, 5.52583051, 5.12719649, ..., 2.07279112, 2.07279112, 2.07279112], ..., [ 4.61482935, 4.47024796, 4.81591608, ..., 8.03948904, 8.03948904, 8.03948904], [ 0.92422831, 0.92422831, 0.92422831, ..., 1.28046414, -0.03145993, -0.03145993], [-0.53976633, -0.53976633, -0.65763254, ..., 5.76290275, 5.76290275, 5.02928256]]) - tau(chain, draw)float641.122 1.122 1.122 ... 2.051 3.239
array([[ 1.1223702 , 1.1223702 , 1.1223702 , ..., 0.03694788, 0.03694788, 0.03694788], [ 1.74417772, 1.62659584, 1.62659584, ..., 9.79903119, 8.14156878, 7.60103129], [ 2.08514909, 2.08514909, 2.22684325, ..., 17.27429606, 17.27429606, 17.27429606], ..., [ 3.61158678, 4.11582 , 4.32372071, ..., 0.22325512, 0.22325512, 0.22325512], [ 0.0385638 , 0.0385638 , 0.0385638 , ..., 0.97799322, 0.71121769, 0.71121769], [ 1.81281716, 1.81281716, 1.81384961, ..., 2.05085976, 2.05085976, 3.23924793]]) - eta0(chain, draw)float64-0.4995 -0.4995 ... 0.4684 0.6057
array([[-0.49953247, -0.49953247, -0.49953247, ..., 0.01908609, 0.01908609, 0.01908609], [ 0.51180636, 0.52862043, 0.52862043, ..., 0.77482336, 1.00139478, 1.01300919], [ 1.08447267, 1.08447267, 1.39778419, ..., 0.81201598, 0.81201598, 0.81201598], ..., [ 0.42927276, 0.52216828, 0.38516008, ..., 0.71909529, 0.71909529, 0.71909529], [-1.07085722, -1.07085722, -1.07085722, ..., -0.63261196, -0.78396615, -0.78396615], [ 0.43718476, 0.43718476, 0.43870856, ..., 0.46842652, 0.46842652, 0.60565958]]) - eta1(chain, draw)float640.2038 0.2038 ... 1.431 1.608
array([[ 0.20375509, 0.20375509, 0.20375509, ..., -0.33392221, -0.33392221, -0.33392221], [-0.47897209, -0.39267028, -0.39267028, ..., 0.36996327, 0.63805827, 0.42878518], [-1.13749575, -1.13749575, -1.43436789, ..., 0.41748271, 0.41748271, 0.41748271], ..., [ 0.72401666, 0.94771601, 0.95452915, ..., 1.04108037, 1.04108037, 1.04108037], [-0.21646498, -0.21646498, -0.21646498, ..., -0.32320034, -0.38804561, -0.38804561], [ 0.05308387, 0.05308387, 0.06135379, ..., 1.43086564, 1.43086564, 1.60761732]]) - eta2(chain, draw)float640.1563 0.1563 ... -1.056 -0.8344
array([[ 0.15629831, 0.15629831, 0.15629831, ..., 0.3755985 , 0.3755985 , 0.3755985 ], [ 0.07646884, 0.22982474, 0.22982474, ..., -0.70063911, -0.71519927, -0.81143714], [ 0.95026631, 0.95026631, 1.5276213 , ..., -0.51019 , -0.51019 , -0.51019 ], ..., [-0.12921561, -0.14536789, -0.20631732, ..., -0.21620162, -0.21620162, -0.21620162], [-0.18553106, -0.18553106, -0.18553106, ..., 1.33819298, 1.50462748, 1.50462748], [ 0.36181655, 0.36181655, 0.3747941 , ..., -1.05638496, -1.05638496, -0.83442841]]) - eta3(chain, draw)float640.04793 0.04793 ... -1.621 -0.8859
array([[ 0.0479263 , 0.0479263 , 0.0479263 , ..., -0.79560144, -0.79560144, -0.79560144], [-0.11674534, 0.009035 , 0.009035 , ..., 0.90278086, 1.15766589, 0.7120672 ], [-0.21965611, -0.21965611, -0.42872324, ..., 0.22067313, 0.22067313, 0.22067313], ..., [-0.16579112, -0.13190644, -0.09796613, ..., 0.83981125, 0.83981125, 0.83981125], [-1.02524753, -1.02524753, -1.02524753, ..., -0.01284912, -0.08905337, -0.08905337], [-0.23527656, -0.23527656, -0.24382442, ..., -1.62086036, -1.62086036, -0.88594592]]) - eta4(chain, draw)float64-1.467 -1.467 ... -1.509 -0.9923
array([[-1.46657444, -1.46657444, -1.46657444, ..., -0.2459569 , -0.2459569 , -0.2459569 ], [ 0.03246754, -0.0400725 , -0.0400725 , ..., 0.06620745, 0.14848399, -0.07355801], [-0.2602346 , -0.2602346 , 0.36360168, ..., -0.60792979, -0.60792979, -0.60792979], ..., [-0.42345642, -0.38157343, -0.52230329, ..., 0.13602594, 0.13602594, 0.13602594], [ 0.45520304, 0.45520304, 0.45520304, ..., -0.62330586, -0.63818442, -0.63818442], [-0.1738624 , -0.1738624 , -0.14768729, ..., -1.50864077, -1.50864077, -0.99230636]]) - eta5(chain, draw)float640.4489 0.4489 ... -0.8137 -0.5359
array([[ 0.44890576, 0.44890576, 0.44890576, ..., 0.30174842, 0.30174842, 0.30174842], [ 1.07737541, 0.92208136, 0.92208136, ..., -0.78676276, -1.00580536, -0.8994664 ], [ 0.11609463, 0.11609463, 0.33724537, ..., 0.17122446, 0.17122446, 0.17122446], ..., [ 0.64240369, 0.79305623, 0.90431255, ..., -0.38252575, -0.38252575, -0.38252575], [-0.41489435, -0.41489435, -0.41489435, ..., -0.22083327, -0.23227815, -0.23227815], [ 0.85061344, 0.85061344, 0.87173743, ..., -0.81374118, -0.81374118, -0.53590256]]) - eta6(chain, draw)float640.1747 0.1747 ... -0.2085 0.0377
array([[ 0.17474467, 0.17474467, 0.17474467, ..., 0.76155516, 0.76155516, 0.76155516], [ 0.0429738 , 0.17987497, 0.17987497, ..., 0.42466312, 0.15725957, 0.05649381], [ 0.73140249, 0.73140249, 1.19271605, ..., 0.42766215, 0.42766215, 0.42766215], ..., [-0.99158183, -0.98537934, -1.20985459, ..., -0.21744701, -0.21744701, -0.21744701], [ 0.49162222, 0.49162222, 0.49162222, ..., -0.15337504, -0.04459114, -0.04459114], [ 0.00923693, 0.00923693, 0.01536582, ..., -0.20851802, -0.20851802, 0.0377028 ]]) - eta7(chain, draw)float640.4413 0.4413 ... 0.1594 -0.03057
array([[ 0.44127792, 0.44127792, 0.44127792, ..., -0.28262954, -0.28262954, -0.28262954], [-0.6736082 , -0.45173637, -0.45173637, ..., -0.70635198, -1.26786956, -0.87499378], [ 0.55427798, 0.55427798, 0.49077358, ..., -0.87502477, -0.87502477, -0.87502477], ..., [ 0.8965947 , 1.06981953, 1.18074916, ..., 0.51383304, 0.51383304, 0.51383304], [ 0.9702864 , 0.9702864 , 0.9702864 , ..., -0.8976637 , -0.91648287, -0.91648287], [-0.08460294, -0.08460294, -0.0978703 , ..., 0.15942518, 0.15942518, -0.03056562]])
- created_at :
- 2021-08-30T18:14:53.861857
- arviz_version :
- 0.11.2
- inference_library :
- emcee
- inference_library_version :
- 3.1.1
<xarray.Dataset> Dimensions: (chain: 40, draw: 1400) Coordinates: * chain (chain) int64 0 1 2 3 4 5 6 7 8 9 ... 30 31 32 33 34 35 36 37 38 39 * draw (draw) int64 100 101 102 103 104 105 ... 1495 1496 1497 1498 1499 Data variables: mu (chain, draw) float64 6.588 6.588 6.588 7.358 ... 5.763 5.763 5.029 tau (chain, draw) float64 1.122 1.122 1.122 1.328 ... 2.051 2.051 3.239 eta0 (chain, draw) float64 -0.4995 -0.4995 -0.4995 ... 0.4684 0.6057 eta1 (chain, draw) float64 0.2038 0.2038 0.2038 ... 1.431 1.431 1.608 eta2 (chain, draw) float64 0.1563 0.1563 0.1563 ... -1.056 -0.8344 eta3 (chain, draw) float64 0.04793 0.04793 0.04793 ... -1.621 -0.8859 eta4 (chain, draw) float64 -1.467 -1.467 -1.467 ... -1.509 -0.9923 eta5 (chain, draw) float64 0.4489 0.4489 0.4489 ... -0.8137 -0.5359 eta6 (chain, draw) float64 0.1747 0.1747 0.1747 ... -0.2085 0.0377 eta7 (chain, draw) float64 0.4413 0.4413 0.4413 ... 0.1594 -0.03057 Attributes: created_at: 2021-08-30T18:14:53.861857 arviz_version: 0.11.2 inference_library: emcee inference_library_version: 3.1.1xarray.Dataset -
- chain: 40
- draw: 1400
- chain(chain)int640 1 2 3 4 5 6 ... 34 35 36 37 38 39
array([ 0, 1, 2, 3, 4, 5, 6, 7, 8, 9, 10, 11, 12, 13, 14, 15, 16, 17, 18, 19, 20, 21, 22, 23, 24, 25, 26, 27, 28, 29, 30, 31, 32, 33, 34, 35, 36, 37, 38, 39]) - draw(draw)int64100 101 102 103 ... 1497 1498 1499
array([ 100, 101, 102, ..., 1497, 1498, 1499])
- lp(chain, draw)float64-14.38 -14.38 ... -20.11 -16.68
array([[-14.37752718, -14.37752718, -14.37752718, ..., -13.44930902, -13.44930902, -13.44930902], [-14.27358555, -13.3607929 , -13.3607929 , ..., -13.70035183, -17.53674728, -14.41060779], [-15.5233782 , -15.5233782 , -19.77298595, ..., -13.55239988, -13.55239988, -13.55239988], ..., [-15.63000723, -16.74445363, -18.12375562, ..., -14.60346133, -14.60346133, -14.60346133], [-17.75897755, -17.75897755, -17.75897755, ..., -17.52355592, -19.35557577, -19.35557577], [-16.21284898, -16.21284898, -16.37273547, ..., -20.1093519 , -20.1093519 , -16.6765458 ]])
- created_at :
- 2021-08-30T18:14:53.851570
- arviz_version :
- 0.11.2
- inference_library :
- emcee
- inference_library_version :
- 3.1.1
<xarray.Dataset> Dimensions: (chain: 40, draw: 1400) Coordinates: * chain (chain) int64 0 1 2 3 4 5 6 7 8 9 ... 30 31 32 33 34 35 36 37 38 39 * draw (draw) int64 100 101 102 103 104 105 ... 1495 1496 1497 1498 1499 Data variables: lp (chain, draw) float64 -14.38 -14.38 -14.38 ... -20.11 -20.11 -16.68 Attributes: created_at: 2021-08-30T18:14:53.851570 arviz_version: 0.11.2 inference_library: emcee inference_library_version: 3.1.1xarray.Dataset -
- arg_0_dim_0: 8
- arg_1_dim_0: 8
- arg_0_dim_0(arg_0_dim_0)int640 1 2 3 4 5 6 7
array([0, 1, 2, 3, 4, 5, 6, 7])
- arg_1_dim_0(arg_1_dim_0)int640 1 2 3 4 5 6 7
array([0, 1, 2, 3, 4, 5, 6, 7])
- arg_0(arg_0_dim_0)float6428.0 8.0 -3.0 7.0 ... 1.0 18.0 12.0
array([28., 8., -3., 7., -1., 1., 18., 12.])
- arg_1(arg_1_dim_0)float6415.0 10.0 16.0 ... 11.0 10.0 18.0
array([15., 10., 16., 11., 9., 11., 10., 18.])
- created_at :
- 2021-08-30T18:14:53.853598
- arviz_version :
- 0.11.2
- inference_library :
- emcee
- inference_library_version :
- 3.1.1
<xarray.Dataset> Dimensions: (arg_0_dim_0: 8, arg_1_dim_0: 8) Coordinates: * arg_0_dim_0 (arg_0_dim_0) int64 0 1 2 3 4 5 6 7 * arg_1_dim_0 (arg_1_dim_0) int64 0 1 2 3 4 5 6 7 Data variables: arg_0 (arg_0_dim_0) float64 28.0 8.0 -3.0 7.0 -1.0 1.0 18.0 12.0 arg_1 (arg_1_dim_0) float64 15.0 10.0 16.0 11.0 9.0 11.0 10.0 18.0 Attributes: created_at: 2021-08-30T18:14:53.853598 arviz_version: 0.11.2 inference_library: emcee inference_library_version: 3.1.1xarray.Dataset
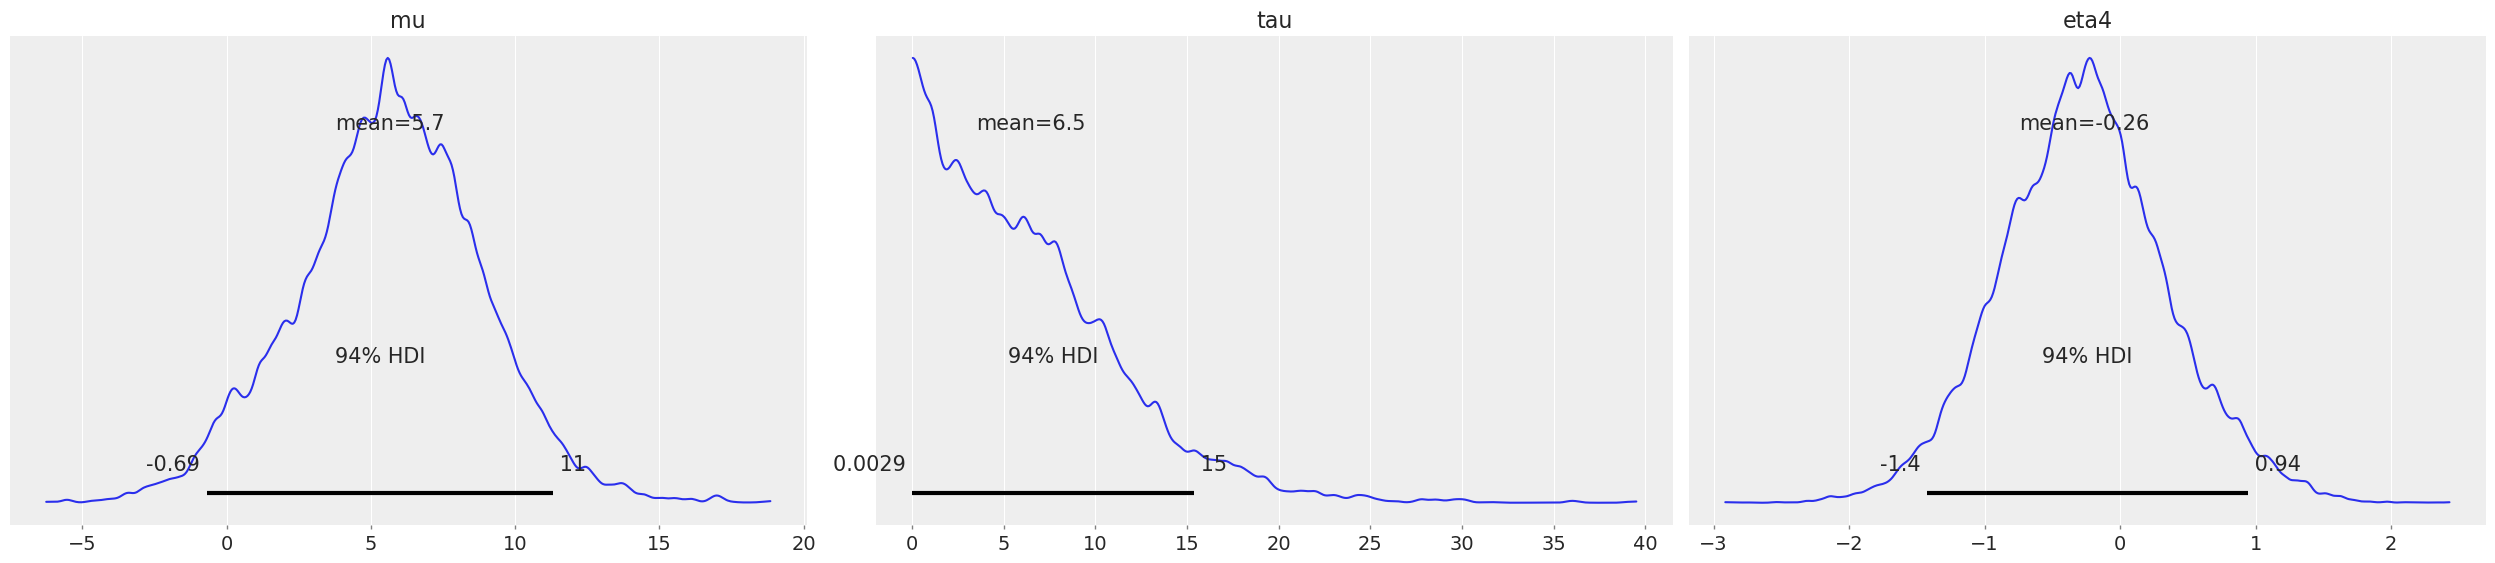
From an InferenceData object, ArviZ’s native data structure, the posterior plot of a few variables can be done in one line:
az.plot_posterior(idata1, var_names=["mu", "tau", "eta4"])
array([<AxesSubplot:title={'center':'mu'}>,
<AxesSubplot:title={'center':'tau'}>,
<AxesSubplot:title={'center':'eta4'}>], dtype=object)
Structuring the posterior as multidimensional variables#
This way of calling from_emcee stores each eta as a different variable, called eta#,
however, they are in fact different dimensions of the same variable.
This can be seen in the code of the likelihood and prior functions, where theta is unpacked as:
mu, tau, eta = theta[0], theta[1], theta[2:]
ArviZ has support for multidimensional variables, and there is a way to tell it how to split the variables like it was done in the likelihood and prior functions:
idata2 = az.from_emcee(sampler, slices=[0, 1, slice(2, None)])
idata2
-
- chain: 40
- draw: 1500
- var_2_dim_0: 8
- chain(chain)int640 1 2 3 4 5 6 ... 34 35 36 37 38 39
array([ 0, 1, 2, 3, 4, 5, 6, 7, 8, 9, 10, 11, 12, 13, 14, 15, 16, 17, 18, 19, 20, 21, 22, 23, 24, 25, 26, 27, 28, 29, 30, 31, 32, 33, 34, 35, 36, 37, 38, 39]) - draw(draw)int640 1 2 3 4 ... 1496 1497 1498 1499
array([ 0, 1, 2, ..., 1497, 1498, 1499])
- var_2_dim_0(var_2_dim_0)int640 1 2 3 4 5 6 7
array([0, 1, 2, 3, 4, 5, 6, 7])
- var_0(chain, draw)float640.6982 0.7962 ... 5.763 5.029
array([[ 0.69824844, 0.79617544, 0.84330726, ..., 5.36725902, 5.36725902, 5.36725902], [ 0.11248859, 0.11248859, 0.06015108, ..., 6.26414247, 7.48213444, 7.62666694], [-0.93632231, -0.93632231, -0.88874485, ..., 2.07279112, 2.07279112, 2.07279112], ..., [-1.39513971, -0.6841303 , -0.22676674, ..., 8.03948904, 8.03948904, 8.03948904], [-0.64258473, -0.63895969, -0.27810694, ..., 1.28046414, -0.03145993, -0.03145993], [-1.51237728, -1.51237728, -1.51237728, ..., 5.76290275, 5.76290275, 5.02928256]]) - var_1(chain, draw)float640.6679 0.7259 ... 2.051 3.239
array([[ 0.66788403, 0.7259102 , 0.80752206, ..., 0.03694788, 0.03694788, 0.03694788], [ 0.3207948 , 0.3207948 , 0.41749554, ..., 9.79903119, 8.14156878, 7.60103129], [ 1.04038851, 1.04038851, 1.06008197, ..., 17.27429606, 17.27429606, 17.27429606], ..., [ 1.33245704, 1.06653867, 1.02533509, ..., 0.22325512, 0.22325512, 0.22325512], [ 0.53704382, 0.49084296, 0.82428818, ..., 0.97799322, 0.71121769, 0.71121769], [ 1.03024648, 1.03024648, 1.03024648, ..., 2.05085976, 2.05085976, 3.23924793]]) - var_2(chain, draw, var_2_dim_0)float640.08153 -0.5837 ... 0.0377 -0.03057
array([[[ 0.08152575, -0.58367651, 0.10398099, ..., 0.04490954, 0.29826293, -0.58949077], [ 0.00851919, -0.63579839, -0.00342714, ..., 0.2302036 , 0.13570644, -0.51653613], [ 0.00771088, -0.82795929, 0.08644913, ..., 0.17352078, 0.1384578 , -0.60913273], ..., [ 0.01908609, -0.33392221, 0.3755985 , ..., 0.30174842, 0.76155516, -0.28262954], [ 0.01908609, -0.33392221, 0.3755985 , ..., 0.30174842, 0.76155516, -0.28262954], [ 0.01908609, -0.33392221, 0.3755985 , ..., 0.30174842, 0.76155516, -0.28262954]], [[ 0.51822161, -0.27190443, 0.7464532 , ..., -1.06344488, 1.27061036, -1.02587602], [ 0.51822161, -0.27190443, 0.7464532 , ..., -1.06344488, 1.27061036, -1.02587602], [ 0.52702754, -0.82228464, 0.37312608, ..., -1.06039012, 0.71765789, -1.18220311], ... [-0.63261196, -0.32320034, 1.33819298, ..., -0.22083327, -0.15337504, -0.8976637 ], [-0.78396615, -0.38804561, 1.50462748, ..., -0.23227815, -0.04459114, -0.91648287], [-0.78396615, -0.38804561, 1.50462748, ..., -0.23227815, -0.04459114, -0.91648287]], [[-0.40230539, -0.34432128, -0.9050526 , ..., 0.00442761, -0.1805794 , 1.80343844], [-0.40230539, -0.34432128, -0.9050526 , ..., 0.00442761, -0.1805794 , 1.80343844], [-0.40230539, -0.34432128, -0.9050526 , ..., 0.00442761, -0.1805794 , 1.80343844], ..., [ 0.46842652, 1.43086564, -1.05638496, ..., -0.81374118, -0.20851802, 0.15942518], [ 0.46842652, 1.43086564, -1.05638496, ..., -0.81374118, -0.20851802, 0.15942518], [ 0.60565958, 1.60761732, -0.83442841, ..., -0.53590256, 0.0377028 , -0.03056562]]])
- created_at :
- 2021-08-30T18:14:54.508656
- arviz_version :
- 0.11.2
- inference_library :
- emcee
- inference_library_version :
- 3.1.1
<xarray.Dataset> Dimensions: (chain: 40, draw: 1500, var_2_dim_0: 8) Coordinates: * chain (chain) int64 0 1 2 3 4 5 6 7 8 ... 31 32 33 34 35 36 37 38 39 * draw (draw) int64 0 1 2 3 4 5 6 ... 1494 1495 1496 1497 1498 1499 * var_2_dim_0 (var_2_dim_0) int64 0 1 2 3 4 5 6 7 Data variables: var_0 (chain, draw) float64 0.6982 0.7962 0.8433 ... 5.763 5.029 var_1 (chain, draw) float64 0.6679 0.7259 0.8075 ... 2.051 3.239 var_2 (chain, draw, var_2_dim_0) float64 0.08153 -0.5837 ... -0.03057 Attributes: created_at: 2021-08-30T18:14:54.508656 arviz_version: 0.11.2 inference_library: emcee inference_library_version: 3.1.1xarray.Dataset -
- chain: 40
- draw: 1500
- chain(chain)int640 1 2 3 4 5 6 ... 34 35 36 37 38 39
array([ 0, 1, 2, 3, 4, 5, 6, 7, 8, 9, 10, 11, 12, 13, 14, 15, 16, 17, 18, 19, 20, 21, 22, 23, 24, 25, 26, 27, 28, 29, 30, 31, 32, 33, 34, 35, 36, 37, 38, 39]) - draw(draw)int640 1 2 3 4 ... 1496 1497 1498 1499
array([ 0, 1, 2, ..., 1497, 1498, 1499])
- lp(chain, draw)float64-16.3 -17.83 ... -20.11 -16.68
array([[-16.29703737, -17.82792262, -18.92214387, ..., -13.44930902,
        -13.44930902, -13.44930902],
       [-23.84232789, -23.84232789, -21.27484126, ..., -13.70035183,
        -17.53674728, -14.41060779],
       [-23.52855761, -23.52855761, -22.5780883 , ..., -13.55239988,
        -13.55239988, -13.55239988],
       ...,
       [-25.50638851, -17.64822888, -15.83134714, ..., -14.60346133,
        -14.60346133, -14.60346133],
       [-25.11716475, -26.98472303, -21.36045048, ..., -17.52355592,
        -19.35557577, -19.35557577],
       [-20.86324354, -20.86324354, -20.86324354, ..., -20.1093519 ,
        -20.1093519 , -16.6765458 ]])
- created_at :
- 2021-08-30T18:14:54.505081
- arviz_version :
- 0.11.2
- inference_library :
- emcee
- inference_library_version :
- 3.1.1
<xarray.Dataset> Dimensions: (chain: 40, draw: 1500) Coordinates: * chain (chain) int64 0 1 2 3 4 5 6 7 8 9 ... 30 31 32 33 34 35 36 37 38 39 * draw (draw) int64 0 1 2 3 4 5 6 7 ... 1493 1494 1495 1496 1497 1498 1499 Data variables: lp (chain, draw) float64 -16.3 -17.83 -18.92 ... -20.11 -20.11 -16.68 Attributes: created_at: 2021-08-30T18:14:54.505081 arviz_version: 0.11.2 inference_library: emcee inference_library_version: 3.1.1xarray.Dataset -
- arg_0_dim_0: 8
- arg_1_dim_0: 8
- arg_0_dim_0(arg_0_dim_0)int640 1 2 3 4 5 6 7
array([0, 1, 2, 3, 4, 5, 6, 7])
- arg_1_dim_0(arg_1_dim_0)int640 1 2 3 4 5 6 7
array([0, 1, 2, 3, 4, 5, 6, 7])
- arg_0(arg_0_dim_0)float6428.0 8.0 -3.0 7.0 ... 1.0 18.0 12.0
array([28., 8., -3., 7., -1., 1., 18., 12.])
- arg_1(arg_1_dim_0)float6415.0 10.0 16.0 ... 11.0 10.0 18.0
array([15., 10., 16., 11., 9., 11., 10., 18.])
- created_at :
- 2021-08-30T18:14:54.506402
- arviz_version :
- 0.11.2
- inference_library :
- emcee
- inference_library_version :
- 3.1.1
<xarray.Dataset> Dimensions: (arg_0_dim_0: 8, arg_1_dim_0: 8) Coordinates: * arg_0_dim_0 (arg_0_dim_0) int64 0 1 2 3 4 5 6 7 * arg_1_dim_0 (arg_1_dim_0) int64 0 1 2 3 4 5 6 7 Data variables: arg_0 (arg_0_dim_0) float64 28.0 8.0 -3.0 7.0 -1.0 1.0 18.0 12.0 arg_1 (arg_1_dim_0) float64 15.0 10.0 16.0 11.0 9.0 11.0 10.0 18.0 Attributes: created_at: 2021-08-30T18:14:54.506402 arviz_version: 0.11.2 inference_library: emcee inference_library_version: 3.1.1xarray.Dataset
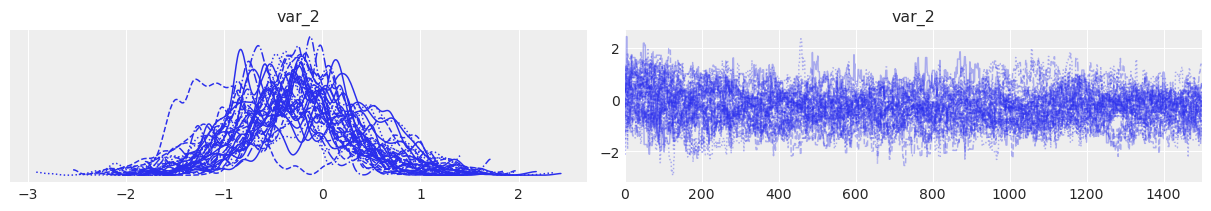
After checking the default variable names, the trace of one dimension of eta can be plotted using ArviZ syntax:
az.plot_trace(idata2, var_names=["var_2"], coords={"var_2_dim_0": 4});
blobs: unlock sample stats, posterior predictive and miscellanea#
Emcee does not store per-draw sample stats, however, it has a functionality called blobs that allows to store any variable on a per-draw basis. It can be used to store some sample_stats or even posterior_predictive data.
You can modify the probability function to use this blobs functionality and store the pointwise log likelihood,
then rerun the sampler using the new function:
def lnprob_8school_blobs(theta, y, s):
prior = log_prior_8school(theta)
like_vect = log_likelihood_8school(theta, y, s)
like = np.sum(like_vect)
return like + prior, like_vect
sampler_blobs = emcee.EnsembleSampler(
nwalkers,
ndim,
lnprob_8school_blobs,
args=(y_obs, sigma),
)
sampler_blobs.run_mcmc(pos, draws);
You can now use the blob_names argument to indicate how to store this blob-defined variable. As the group is not specified, it will go to sample_stats.
Note that the argument blob_names is added to the arguments covered in the previous examples and we are also introducing coords and dims arguments to show the power and flexibility of the converter. For more on coords and dims see page_in_construction.
dims = {"eta": ["school"], "log_likelihood": ["school"]}
idata3 = az.from_emcee(
sampler_blobs,
var_names=["mu", "tau", "eta"],
slices=[0, 1, slice(2, None)],
blob_names=["log_likelihood"],
dims=dims,
coords={"school": range(8)},
)
idata3
-
- chain: 40
- draw: 1500
- school: 8
- chain(chain)int640 1 2 3 4 5 6 ... 34 35 36 37 38 39
array([ 0, 1, 2, 3, 4, 5, 6, 7, 8, 9, 10, 11, 12, 13, 14, 15, 16, 17, 18, 19, 20, 21, 22, 23, 24, 25, 26, 27, 28, 29, 30, 31, 32, 33, 34, 35, 36, 37, 38, 39]) - draw(draw)int640 1 2 3 4 ... 1496 1497 1498 1499
array([ 0, 1, 2, ..., 1497, 1498, 1499])
- school(school)int640 1 2 3 4 5 6 7
array([0, 1, 2, 3, 4, 5, 6, 7])
- mu(chain, draw)float640.6982 0.7962 ... 5.763 5.029
array([[ 0.69824844, 0.79617544, 0.84330726, ..., 5.36725902, 5.36725902, 5.36725902], [ 0.11248859, 0.11248859, 0.06015108, ..., 6.26414247, 7.48213444, 7.62666694], [-0.93632231, -0.93632231, -0.88874485, ..., 2.07279112, 2.07279112, 2.07279112], ..., [-1.39513971, -0.6841303 , -0.22676674, ..., 8.03948904, 8.03948904, 8.03948904], [-0.64258473, -0.63895969, -0.27810694, ..., 1.28046414, -0.03145993, -0.03145993], [-1.51237728, -1.51237728, -1.51237728, ..., 5.76290275, 5.76290275, 5.02928256]]) - tau(chain, draw)float640.6679 0.7259 ... 2.051 3.239
array([[ 0.66788403, 0.7259102 , 0.80752206, ..., 0.03694788, 0.03694788, 0.03694788], [ 0.3207948 , 0.3207948 , 0.41749554, ..., 9.79903119, 8.14156878, 7.60103129], [ 1.04038851, 1.04038851, 1.06008197, ..., 17.27429606, 17.27429606, 17.27429606], ..., [ 1.33245704, 1.06653867, 1.02533509, ..., 0.22325512, 0.22325512, 0.22325512], [ 0.53704382, 0.49084296, 0.82428818, ..., 0.97799322, 0.71121769, 0.71121769], [ 1.03024648, 1.03024648, 1.03024648, ..., 2.05085976, 2.05085976, 3.23924793]]) - eta(chain, draw, school)float640.08153 -0.5837 ... 0.0377 -0.03057
array([[[ 0.08152575, -0.58367651, 0.10398099, ..., 0.04490954, 0.29826293, -0.58949077], [ 0.00851919, -0.63579839, -0.00342714, ..., 0.2302036 , 0.13570644, -0.51653613], [ 0.00771088, -0.82795929, 0.08644913, ..., 0.17352078, 0.1384578 , -0.60913273], ..., [ 0.01908609, -0.33392221, 0.3755985 , ..., 0.30174842, 0.76155516, -0.28262954], [ 0.01908609, -0.33392221, 0.3755985 , ..., 0.30174842, 0.76155516, -0.28262954], [ 0.01908609, -0.33392221, 0.3755985 , ..., 0.30174842, 0.76155516, -0.28262954]], [[ 0.51822161, -0.27190443, 0.7464532 , ..., -1.06344488, 1.27061036, -1.02587602], [ 0.51822161, -0.27190443, 0.7464532 , ..., -1.06344488, 1.27061036, -1.02587602], [ 0.52702754, -0.82228464, 0.37312608, ..., -1.06039012, 0.71765789, -1.18220311], ... [-0.63261196, -0.32320034, 1.33819298, ..., -0.22083327, -0.15337504, -0.8976637 ], [-0.78396615, -0.38804561, 1.50462748, ..., -0.23227815, -0.04459114, -0.91648287], [-0.78396615, -0.38804561, 1.50462748, ..., -0.23227815, -0.04459114, -0.91648287]], [[-0.40230539, -0.34432128, -0.9050526 , ..., 0.00442761, -0.1805794 , 1.80343844], [-0.40230539, -0.34432128, -0.9050526 , ..., 0.00442761, -0.1805794 , 1.80343844], [-0.40230539, -0.34432128, -0.9050526 , ..., 0.00442761, -0.1805794 , 1.80343844], ..., [ 0.46842652, 1.43086564, -1.05638496, ..., -0.81374118, -0.20851802, 0.15942518], [ 0.46842652, 1.43086564, -1.05638496, ..., -0.81374118, -0.20851802, 0.15942518], [ 0.60565958, 1.60761732, -0.83442841, ..., -0.53590256, 0.0377028 , -0.03056562]]])
- created_at :
- 2021-08-30T18:14:57.535401
- arviz_version :
- 0.11.2
- inference_library :
- emcee
- inference_library_version :
- 3.1.1
<xarray.Dataset> Dimensions: (chain: 40, draw: 1500, school: 8) Coordinates: * chain (chain) int64 0 1 2 3 4 5 6 7 8 9 ... 30 31 32 33 34 35 36 37 38 39 * draw (draw) int64 0 1 2 3 4 5 6 7 ... 1493 1494 1495 1496 1497 1498 1499 * school (school) int64 0 1 2 3 4 5 6 7 Data variables: mu (chain, draw) float64 0.6982 0.7962 0.8433 ... 5.763 5.763 5.029 tau (chain, draw) float64 0.6679 0.7259 0.8075 ... 2.051 2.051 3.239 eta (chain, draw, school) float64 0.08153 -0.5837 ... 0.0377 -0.03057 Attributes: created_at: 2021-08-30T18:14:57.535401 arviz_version: 0.11.2 inference_library: emcee inference_library_version: 3.1.1xarray.Dataset -
- chain: 40
- draw: 1500
- school: 8
- chain(chain)int640 1 2 3 4 5 6 ... 34 35 36 37 38 39
array([ 0, 1, 2, 3, 4, 5, 6, 7, 8, 9, 10, 11, 12, 13, 14, 15, 16, 17, 18, 19, 20, 21, 22, 23, 24, 25, 26, 27, 28, 29, 30, 31, 32, 33, 34, 35, 36, 37, 38, 39]) - draw(draw)int640 1 2 3 4 ... 1496 1497 1498 1499
array([ 0, 1, 2, ..., 1497, 1498, 1499])
- school(school)int640 1 2 3 4 5 6 7
array([0, 1, 2, 3, 4, 5, 6, 7])
- log_likelihood(chain, draw, school)float64-3.3 -0.5916 ... -1.651 -0.1543
array([[[-3.29962425e+00, -5.91603994e-01, -5.54512921e-02, ..., -6.10346874e-04, -2.92497097e+00, -4.22172393e-01], [-3.28760730e+00, -5.87576994e-01, -5.62190075e-02, ..., -1.11418891e-05, -2.92591763e+00, -4.13790819e-01], [-3.27621247e+00, -6.12351344e-01, -5.98143882e-02, ..., -2.26937336e-06, -2.90528105e+00, -4.18794556e-01], ..., [-2.27648464e+00, -6.99644132e-02, -2.74388479e-01, ..., -1.58433525e-01, -1.58876020e+00, -1.36209530e-01], [-2.27648464e+00, -6.99644132e-02, -2.74388479e-01, ..., -1.58433525e-01, -1.58876020e+00, -1.36209530e-01], [-2.27648464e+00, -6.99644132e-02, -2.74388479e-01, ..., -1.58433525e-01, -1.58876020e+00, -1.36209530e-01]], [[-3.41541659e+00, -6.35964292e-01, -4.38888593e-02, ..., -1.24760573e-02, -3.05547121e+00, -4.60634226e-01], [-3.41541659e+00, -6.35964292e-01, -4.38888593e-02, ..., -1.24760573e-02, -3.05547121e+00, -4.60634226e-01], [-3.41505897e+00, -6.86105588e-01, -4.03992301e-02, ..., -1.57972233e-02, -3.11177713e+00, -4.77128919e-01], ... [-3.32168269e+00, -4.94999995e-01, -1.22028296e-01, ..., -3.43723125e-05, -2.84581232e+00, -4.15125703e-01], [-3.63258963e+00, -6.90136396e-01, -6.37138926e-02, ..., -1.18346757e-02, -3.26278253e+00, -4.96498642e-01], [-3.63258963e+00, -6.90136396e-01, -6.37138926e-02, ..., -1.18346757e-02, -3.26278253e+00, -4.96498642e-01]], [[-3.98051738e+00, -9.73599203e-01, -1.20407032e-03, ..., -5.19763621e-02, -3.88027694e+00, -4.19212449e-01], [-3.98051738e+00, -9.73599203e-01, -1.20407032e-03, ..., -5.19763621e-02, -3.88027694e+00, -4.19212449e-01], [-3.98051738e+00, -9.73599203e-01, -1.20407032e-03, ..., -5.19763621e-02, -3.88027694e+00, -4.19212449e-01], ..., [-2.01193802e+00, -4.86377256e-03, -1.69970952e-01, ..., -7.91160711e-02, -1.60395600e+00, -1.07807833e-01], [-2.01193802e+00, -4.86377256e-03, -1.69970952e-01, ..., -7.91160711e-02, -1.60395600e+00, -1.07807833e-01], [-1.96164971e+00, -5.00306683e-02, -1.10820832e-01, ..., -4.34669926e-02, -1.65086232e+00, -1.54262471e-01]]])
- created_at :
- 2021-08-30T18:14:57.531408
- arviz_version :
- 0.11.2
- inference_library :
- emcee
- inference_library_version :
- 3.1.1
<xarray.Dataset> Dimensions: (chain: 40, draw: 1500, school: 8) Coordinates: * chain (chain) int64 0 1 2 3 4 5 6 7 8 ... 32 33 34 35 36 37 38 39 * draw (draw) int64 0 1 2 3 4 5 6 ... 1494 1495 1496 1497 1498 1499 * school (school) int64 0 1 2 3 4 5 6 7 Data variables: log_likelihood (chain, draw, school) float64 -3.3 -0.5916 ... -0.1543 Attributes: created_at: 2021-08-30T18:14:57.531408 arviz_version: 0.11.2 inference_library: emcee inference_library_version: 3.1.1xarray.Dataset -
- chain: 40
- draw: 1500
- chain(chain)int640 1 2 3 4 5 6 ... 34 35 36 37 38 39
array([ 0, 1, 2, 3, 4, 5, 6, 7, 8, 9, 10, 11, 12, 13, 14, 15, 16, 17, 18, 19, 20, 21, 22, 23, 24, 25, 26, 27, 28, 29, 30, 31, 32, 33, 34, 35, 36, 37, 38, 39]) - draw(draw)int640 1 2 3 4 ... 1496 1497 1498 1499
array([ 0, 1, 2, ..., 1497, 1498, 1499])
- lp(chain, draw)float64-16.3 -17.83 ... -20.11 -16.68
array([[-16.29703737, -17.82792262, -18.92214387, ..., -13.44930902, -13.44930902, -13.44930902], [-23.84232789, -23.84232789, -21.27484126, ..., -13.70035183, -17.53674728, -14.41060779], [-23.52855761, -23.52855761, -22.5780883 , ..., -13.55239988, -13.55239988, -13.55239988], ..., [-25.50638851, -17.64822888, -15.83134714, ..., -14.60346133, -14.60346133, -14.60346133], [-25.11716475, -26.98472303, -21.36045048, ..., -17.52355592, -19.35557577, -19.35557577], [-20.86324354, -20.86324354, -20.86324354, ..., -20.1093519 , -20.1093519 , -16.6765458 ]])
- created_at :
- 2021-08-30T18:14:57.532516
- arviz_version :
- 0.11.2
- inference_library :
- emcee
- inference_library_version :
- 3.1.1
<xarray.Dataset> Dimensions: (chain: 40, draw: 1500) Coordinates: * chain (chain) int64 0 1 2 3 4 5 6 7 8 9 ... 30 31 32 33 34 35 36 37 38 39 * draw (draw) int64 0 1 2 3 4 5 6 7 ... 1493 1494 1495 1496 1497 1498 1499 Data variables: lp (chain, draw) float64 -16.3 -17.83 -18.92 ... -20.11 -20.11 -16.68 Attributes: created_at: 2021-08-30T18:14:57.532516 arviz_version: 0.11.2 inference_library: emcee inference_library_version: 3.1.1xarray.Dataset -
- arg_0_dim_0: 8
- arg_1_dim_0: 8
- arg_0_dim_0(arg_0_dim_0)int640 1 2 3 4 5 6 7
array([0, 1, 2, 3, 4, 5, 6, 7])
- arg_1_dim_0(arg_1_dim_0)int640 1 2 3 4 5 6 7
array([0, 1, 2, 3, 4, 5, 6, 7])
- arg_0(arg_0_dim_0)float6428.0 8.0 -3.0 7.0 ... 1.0 18.0 12.0
array([28., 8., -3., 7., -1., 1., 18., 12.])
- arg_1(arg_1_dim_0)float6415.0 10.0 16.0 ... 11.0 10.0 18.0
array([15., 10., 16., 11., 9., 11., 10., 18.])
- created_at :
- 2021-08-30T18:14:57.533391
- arviz_version :
- 0.11.2
- inference_library :
- emcee
- inference_library_version :
- 3.1.1
<xarray.Dataset> Dimensions: (arg_0_dim_0: 8, arg_1_dim_0: 8) Coordinates: * arg_0_dim_0 (arg_0_dim_0) int64 0 1 2 3 4 5 6 7 * arg_1_dim_0 (arg_1_dim_0) int64 0 1 2 3 4 5 6 7 Data variables: arg_0 (arg_0_dim_0) float64 28.0 8.0 -3.0 7.0 -1.0 1.0 18.0 12.0 arg_1 (arg_1_dim_0) float64 15.0 10.0 16.0 11.0 9.0 11.0 10.0 18.0 Attributes: created_at: 2021-08-30T18:14:57.533391 arviz_version: 0.11.2 inference_library: emcee inference_library_version: 3.1.1xarray.Dataset
Multi-group blobs#
You might even have more complicated blobs, each corresponding to a different group of the InferenceData object. Moreover, you can store the variables passed to the EnsembleSampler via the args argument in observed or constant data groups. This is shown in the example below:
sampler_blobs.blobs[0, 1]
array([-3.41541659e+00, -6.35964292e-01, -4.38888593e-02, -4.32716958e-01,
-3.27623973e-03, -1.24760573e-02, -3.05547121e+00, -4.60634226e-01])
def lnprob_8school_blobs(theta, y, sigma):
mu, tau, eta = theta[0], theta[1], theta[2:]
prior = log_prior_8school(theta)
like_vect = log_likelihood_8school(theta, y, sigma)
like = np.sum(like_vect)
# store pointwise log likelihood, useful for model comparison with az.loo or az.waic
# and posterior predictive samples as blobs
return like + prior, (like_vect, np.random.normal((mu + tau * eta), sigma))
sampler_blobs = emcee.EnsembleSampler(
nwalkers,
ndim,
lnprob_8school_blobs,
args=(y_obs, sigma),
)
sampler_blobs.run_mcmc(pos, draws)
dims = {"eta": ["school"], "log_likelihood": ["school"], "y": ["school"]}
idata4 = az.from_emcee(
sampler_blobs,
var_names=["mu", "tau", "eta"],
slices=[0, 1, slice(2, None)],
arg_names=["y", "sigma"],
arg_groups=["observed_data", "constant_data"],
blob_names=["log_likelihood", "y"],
blob_groups=["log_likelihood", "posterior_predictive"],
dims=dims,
coords={"school": range(8)},
)
idata4
-
- chain: 40
- draw: 1500
- school: 8
- chain(chain)int640 1 2 3 4 5 6 ... 34 35 36 37 38 39
array([ 0, 1, 2, 3, 4, 5, 6, 7, 8, 9, 10, 11, 12, 13, 14, 15, 16, 17, 18, 19, 20, 21, 22, 23, 24, 25, 26, 27, 28, 29, 30, 31, 32, 33, 34, 35, 36, 37, 38, 39]) - draw(draw)int640 1 2 3 4 ... 1496 1497 1498 1499
array([ 0, 1, 2, ..., 1497, 1498, 1499])
- school(school)int640 1 2 3 4 5 6 7
array([0, 1, 2, 3, 4, 5, 6, 7])
- mu(chain, draw)float640.6982 0.7962 ... 5.763 5.029
array([[ 0.69824844, 0.79617544, 0.84330726, ..., 5.36725902, 5.36725902, 5.36725902], [ 0.11248859, 0.11248859, 0.06015108, ..., 6.26414247, 7.48213444, 7.62666694], [-0.93632231, -0.93632231, -0.88874485, ..., 2.07279112, 2.07279112, 2.07279112], ..., [-1.39513971, -0.6841303 , -0.22676674, ..., 8.03948904, 8.03948904, 8.03948904], [-0.64258473, -0.63895969, -0.27810694, ..., 1.28046414, -0.03145993, -0.03145993], [-1.51237728, -1.51237728, -1.51237728, ..., 5.76290275, 5.76290275, 5.02928256]]) - tau(chain, draw)float640.6679 0.7259 ... 2.051 3.239
array([[ 0.66788403, 0.7259102 , 0.80752206, ..., 0.03694788, 0.03694788, 0.03694788], [ 0.3207948 , 0.3207948 , 0.41749554, ..., 9.79903119, 8.14156878, 7.60103129], [ 1.04038851, 1.04038851, 1.06008197, ..., 17.27429606, 17.27429606, 17.27429606], ..., [ 1.33245704, 1.06653867, 1.02533509, ..., 0.22325512, 0.22325512, 0.22325512], [ 0.53704382, 0.49084296, 0.82428818, ..., 0.97799322, 0.71121769, 0.71121769], [ 1.03024648, 1.03024648, 1.03024648, ..., 2.05085976, 2.05085976, 3.23924793]]) - eta(chain, draw, school)float640.08153 -0.5837 ... 0.0377 -0.03057
array([[[ 0.08152575, -0.58367651,  0.10398099, ...,  0.04490954,
          0.29826293, -0.58949077],
        [ 0.00851919, -0.63579839, -0.00342714, ...,  0.2302036 ,
          0.13570644, -0.51653613],
        [ 0.00771088, -0.82795929,  0.08644913, ...,  0.17352078,
          0.1384578 , -0.60913273],
        ...,
        [ 0.01908609, -0.33392221,  0.3755985 , ...,  0.30174842,
          0.76155516, -0.28262954],
        [ 0.01908609, -0.33392221,  0.3755985 , ...,  0.30174842,
          0.76155516, -0.28262954],
        [ 0.01908609, -0.33392221,  0.3755985 , ...,  0.30174842,
          0.76155516, -0.28262954]],

       [[ 0.51822161, -0.27190443,  0.7464532 , ..., -1.06344488,
          1.27061036, -1.02587602],
        [ 0.51822161, -0.27190443,  0.7464532 , ..., -1.06344488,
          1.27061036, -1.02587602],
        [ 0.52702754, -0.82228464,  0.37312608, ..., -1.06039012,
          0.71765789, -1.18220311],
...
        [-0.63261196, -0.32320034,  1.33819298, ..., -0.22083327,
         -0.15337504, -0.8976637 ],
        [-0.78396615, -0.38804561,  1.50462748, ..., -0.23227815,
         -0.04459114, -0.91648287],
        [-0.78396615, -0.38804561,  1.50462748, ..., -0.23227815,
         -0.04459114, -0.91648287]],

       [[-0.40230539, -0.34432128, -0.9050526 , ...,  0.00442761,
         -0.1805794 ,  1.80343844],
        [-0.40230539, -0.34432128, -0.9050526 , ...,  0.00442761,
         -0.1805794 ,  1.80343844],
        [-0.40230539, -0.34432128, -0.9050526 , ...,  0.00442761,
         -0.1805794 ,  1.80343844],
        ...,
        [ 0.46842652,  1.43086564, -1.05638496, ..., -0.81374118,
         -0.20851802,  0.15942518],
        [ 0.46842652,  1.43086564, -1.05638496, ..., -0.81374118,
         -0.20851802,  0.15942518],
        [ 0.60565958,  1.60761732, -0.83442841, ..., -0.53590256,
          0.0377028 , -0.03056562]]])
- created_at :
- 2021-08-30T18:15:01.274909
- arviz_version :
- 0.11.2
- inference_library :
- emcee
- inference_library_version :
- 3.1.1
<xarray.Dataset> Dimensions: (chain: 40, draw: 1500, school: 8) Coordinates: * chain (chain) int64 0 1 2 3 4 5 6 7 8 9 ... 30 31 32 33 34 35 36 37 38 39 * draw (draw) int64 0 1 2 3 4 5 6 7 ... 1493 1494 1495 1496 1497 1498 1499 * school (school) int64 0 1 2 3 4 5 6 7 Data variables: mu (chain, draw) float64 0.6982 0.7962 0.8433 ... 5.763 5.763 5.029 tau (chain, draw) float64 0.6679 0.7259 0.8075 ... 2.051 2.051 3.239 eta (chain, draw, school) float64 0.08153 -0.5837 ... 0.0377 -0.03057 Attributes: created_at: 2021-08-30T18:15:01.274909 arviz_version: 0.11.2 inference_library: emcee inference_library_version: 3.1.1xarray.Dataset -
- chain: 40
- draw: 1500
- school: 8
- chain(chain)int640 1 2 3 4 5 6 ... 34 35 36 37 38 39
array([ 0, 1, 2, 3, 4, 5, 6, 7, 8, 9, 10, 11, 12, 13, 14, 15, 16, 17, 18, 19, 20, 21, 22, 23, 24, 25, 26, 27, 28, 29, 30, 31, 32, 33, 34, 35, 36, 37, 38, 39]) - draw(draw)int640 1 2 3 4 ... 1496 1497 1498 1499
array([ 0, 1, 2, ..., 1497, 1498, 1499])
- school(school)int640 1 2 3 4 5 6 7
array([0, 1, 2, 3, 4, 5, 6, 7])
- y(chain, draw, school)float642.55 -6.472 -27.52 ... -0.198 23.99
array([[[ 2.55033076, -6.47211535, -27.51745706, ..., 6.91654057, 1.43708434, 34.38440582], [ 10.56568241, -13.09651652, -0.97103654, ..., 8.26658892, -1.98414079, -1.63886384], [-10.82120742, -8.81999555, 4.70804147, ..., 15.28034757, 6.92289175, -15.92737786], ..., [ 11.94492479, 10.80561966, -20.08957419, ..., 12.83706645, 7.30085292, 11.12453816], [ 11.94492479, 10.80561966, -20.08957419, ..., 12.83706645, 7.30085292, 11.12453816], [ 11.94492479, 10.80561966, -20.08957419, ..., 12.83706645, 7.30085292, 11.12453816]], [[ 16.21807858, -19.11367164, -25.25396006, ..., -1.51342814, -14.31565159, -21.57067662], [ 16.21807858, -19.11367164, -25.25396006, ..., -1.51342814, -14.31565159, -21.57067662], [ 5.99596366, -3.37233749, 14.76088223, ..., 3.03048959, -7.99827993, -27.87050399], ... [ 25.0713929 , 0.77571313, -16.857685 , ..., -7.6442145 , -6.94906266, -11.53403959], [-11.57514461, -14.76384044, 20.59296446, ..., -8.05191719, 5.25269844, -21.68638323], [-11.57514461, -14.76384044, 20.59296446, ..., -8.05191719, 5.25269844, -21.68638323]], [[-16.08108296, -5.25404432, -8.11886536, ..., 12.99207495, 5.32679948, 17.36514081], [-16.08108296, -5.25404432, -8.11886536, ..., 12.99207495, 5.32679948, 17.36514081], [-16.08108296, -5.25404432, -8.11886536, ..., 12.99207495, 5.32679948, 17.36514081], ..., [ 16.5054522 , -2.42689047, 15.45936197, ..., 15.14612022, 25.58293034, -8.32778174], [ 16.5054522 , -2.42689047, 15.45936197, ..., 15.14612022, 25.58293034, -8.32778174], [ 8.66840951, 1.67157617, -6.29182259, ..., -5.42734439, -0.19801562, 23.99112792]]])
- created_at :
- 2021-08-30T18:15:01.270461
- arviz_version :
- 0.11.2
- inference_library :
- emcee
- inference_library_version :
- 3.1.1
<xarray.Dataset> Dimensions: (chain: 40, draw: 1500, school: 8) Coordinates: * chain (chain) int64 0 1 2 3 4 5 6 7 8 9 ... 30 31 32 33 34 35 36 37 38 39 * draw (draw) int64 0 1 2 3 4 5 6 7 ... 1493 1494 1495 1496 1497 1498 1499 * school (school) int64 0 1 2 3 4 5 6 7 Data variables: y (chain, draw, school) float64 2.55 -6.472 -27.52 ... -0.198 23.99 Attributes: created_at: 2021-08-30T18:15:01.270461 arviz_version: 0.11.2 inference_library: emcee inference_library_version: 3.1.1xarray.Dataset -
- chain: 40
- draw: 1500
- school: 8
- chain(chain)int640 1 2 3 4 5 6 ... 34 35 36 37 38 39
array([ 0, 1, 2, 3, 4, 5, 6, 7, 8, 9, 10, 11, 12, 13, 14, 15, 16, 17, 18, 19, 20, 21, 22, 23, 24, 25, 26, 27, 28, 29, 30, 31, 32, 33, 34, 35, 36, 37, 38, 39]) - draw(draw)int640 1 2 3 4 ... 1496 1497 1498 1499
array([ 0, 1, 2, ..., 1497, 1498, 1499])
- school(school)int640 1 2 3 4 5 6 7
array([0, 1, 2, 3, 4, 5, 6, 7])
- log_likelihood(chain, draw, school)float64-3.3 -0.5916 ... -1.651 -0.1543
array([[[-3.29962425e+00, -5.91603994e-01, -5.54512921e-02, ..., -6.10346874e-04, -2.92497097e+00, -4.22172393e-01], [-3.28760730e+00, -5.87576994e-01, -5.62190075e-02, ..., -1.11418891e-05, -2.92591763e+00, -4.13790819e-01], [-3.27621247e+00, -6.12351344e-01, -5.98143882e-02, ..., -2.26937336e-06, -2.90528105e+00, -4.18794556e-01], ..., [-2.27648464e+00, -6.99644132e-02, -2.74388479e-01, ..., -1.58433525e-01, -1.58876020e+00, -1.36209530e-01], [-2.27648464e+00, -6.99644132e-02, -2.74388479e-01, ..., -1.58433525e-01, -1.58876020e+00, -1.36209530e-01], [-2.27648464e+00, -6.99644132e-02, -2.74388479e-01, ..., -1.58433525e-01, -1.58876020e+00, -1.36209530e-01]], [[-3.41541659e+00, -6.35964292e-01, -4.38888593e-02, ..., -1.24760573e-02, -3.05547121e+00, -4.60634226e-01], [-3.41541659e+00, -6.35964292e-01, -4.38888593e-02, ..., -1.24760573e-02, -3.05547121e+00, -4.60634226e-01], [-3.41505897e+00, -6.86105588e-01, -4.03992301e-02, ..., -1.57972233e-02, -3.11177713e+00, -4.77128919e-01], ... [-3.32168269e+00, -4.94999995e-01, -1.22028296e-01, ..., -3.43723125e-05, -2.84581232e+00, -4.15125703e-01], [-3.63258963e+00, -6.90136396e-01, -6.37138926e-02, ..., -1.18346757e-02, -3.26278253e+00, -4.96498642e-01], [-3.63258963e+00, -6.90136396e-01, -6.37138926e-02, ..., -1.18346757e-02, -3.26278253e+00, -4.96498642e-01]], [[-3.98051738e+00, -9.73599203e-01, -1.20407032e-03, ..., -5.19763621e-02, -3.88027694e+00, -4.19212449e-01], [-3.98051738e+00, -9.73599203e-01, -1.20407032e-03, ..., -5.19763621e-02, -3.88027694e+00, -4.19212449e-01], [-3.98051738e+00, -9.73599203e-01, -1.20407032e-03, ..., -5.19763621e-02, -3.88027694e+00, -4.19212449e-01], ..., [-2.01193802e+00, -4.86377256e-03, -1.69970952e-01, ..., -7.91160711e-02, -1.60395600e+00, -1.07807833e-01], [-2.01193802e+00, -4.86377256e-03, -1.69970952e-01, ..., -7.91160711e-02, -1.60395600e+00, -1.07807833e-01], [-1.96164971e+00, -5.00306683e-02, -1.10820832e-01, ..., -4.34669926e-02, -1.65086232e+00, -1.54262471e-01]]])
- created_at :
- 2021-08-30T18:15:01.271500
- arviz_version :
- 0.11.2
- inference_library :
- emcee
- inference_library_version :
- 3.1.1
<xarray.Dataset> Dimensions: (chain: 40, draw: 1500, school: 8) Coordinates: * chain (chain) int64 0 1 2 3 4 5 6 7 8 ... 32 33 34 35 36 37 38 39 * draw (draw) int64 0 1 2 3 4 5 6 ... 1494 1495 1496 1497 1498 1499 * school (school) int64 0 1 2 3 4 5 6 7 Data variables: log_likelihood (chain, draw, school) float64 -3.3 -0.5916 ... -0.1543 Attributes: created_at: 2021-08-30T18:15:01.271500 arviz_version: 0.11.2 inference_library: emcee inference_library_version: 3.1.1xarray.Dataset -
- chain: 40
- draw: 1500
- chain(chain)int640 1 2 3 4 5 6 ... 34 35 36 37 38 39
array([ 0, 1, 2, 3, 4, 5, 6, 7, 8, 9, 10, 11, 12, 13, 14, 15, 16, 17, 18, 19, 20, 21, 22, 23, 24, 25, 26, 27, 28, 29, 30, 31, 32, 33, 34, 35, 36, 37, 38, 39]) - draw(draw)int640 1 2 3 4 ... 1496 1497 1498 1499
array([ 0, 1, 2, ..., 1497, 1498, 1499])
- lp(chain, draw)float64-16.3 -17.83 ... -20.11 -16.68
array([[-16.29703737, -17.82792262, -18.92214387, ..., -13.44930902,
        -13.44930902, -13.44930902],
       [-23.84232789, -23.84232789, -21.27484126, ..., -13.70035183,
        -17.53674728, -14.41060779],
       [-23.52855761, -23.52855761, -22.5780883 , ..., -13.55239988,
        -13.55239988, -13.55239988],
       ...,
       [-25.50638851, -17.64822888, -15.83134714, ..., -14.60346133,
        -14.60346133, -14.60346133],
       [-25.11716475, -26.98472303, -21.36045048, ..., -17.52355592,
        -19.35557577, -19.35557577],
       [-20.86324354, -20.86324354, -20.86324354, ..., -20.1093519 ,
        -20.1093519 , -16.6765458 ]])
- created_at :
- 2021-08-30T18:15:01.272272
- arviz_version :
- 0.11.2
- inference_library :
- emcee
- inference_library_version :
- 3.1.1
<xarray.Dataset>
Dimensions:  (chain: 40, draw: 1500)
Coordinates:
  * chain    (chain) int64 0 1 2 3 4 5 6 7 8 9 ... 30 31 32 33 34 35 36 37 38 39
  * draw     (draw) int64 0 1 2 3 4 5 6 7 ... 1493 1494 1495 1496 1497 1498 1499
Data variables:
    lp       (chain, draw) float64 -16.3 -17.83 -18.92 ... -20.11 -20.11 -16.68
Attributes:
    created_at:                 2021-08-30T18:15:01.272272
    arviz_version:              0.11.2
    inference_library:          emcee
    inference_library_version:  3.1.1
xarray.Dataset -
- school: 8
- school(school)int640 1 2 3 4 5 6 7
array([0, 1, 2, 3, 4, 5, 6, 7])
- y(school)float6428.0 8.0 -3.0 7.0 ... 1.0 18.0 12.0
array([28., 8., -3., 7., -1., 1., 18., 12.])
- created_at :
- 2021-08-30T18:15:01.273600
- arviz_version :
- 0.11.2
- inference_library :
- emcee
- inference_library_version :
- 3.1.1
<xarray.Dataset>
Dimensions:  (school: 8)
Coordinates:
  * school   (school) int64 0 1 2 3 4 5 6 7
Data variables:
    y        (school) float64 28.0 8.0 -3.0 7.0 -1.0 1.0 18.0 12.0
Attributes:
    created_at:                 2021-08-30T18:15:01.273600
    arviz_version:              0.11.2
    inference_library:          emcee
    inference_library_version:  3.1.1
xarray.Dataset -
- sigma_dim_0: 8
- sigma_dim_0(sigma_dim_0)int640 1 2 3 4 5 6 7
array([0, 1, 2, 3, 4, 5, 6, 7])
- sigma(sigma_dim_0)float6415.0 10.0 16.0 ... 11.0 10.0 18.0
array([15., 10., 16., 11., 9., 11., 10., 18.])
- created_at :
- 2021-08-30T18:15:01.273208
- arviz_version :
- 0.11.2
- inference_library :
- emcee
- inference_library_version :
- 3.1.1
<xarray.Dataset>
Dimensions:      (sigma_dim_0: 8)
Coordinates:
  * sigma_dim_0  (sigma_dim_0) int64 0 1 2 3 4 5 6 7
Data variables:
    sigma        (sigma_dim_0) float64 15.0 10.0 16.0 11.0 9.0 11.0 10.0 18.0
Attributes:
    created_at:                 2021-08-30T18:15:01.273208
    arviz_version:              0.11.2
    inference_library:          emcee
    inference_library_version:  3.1.1
xarray.Dataset
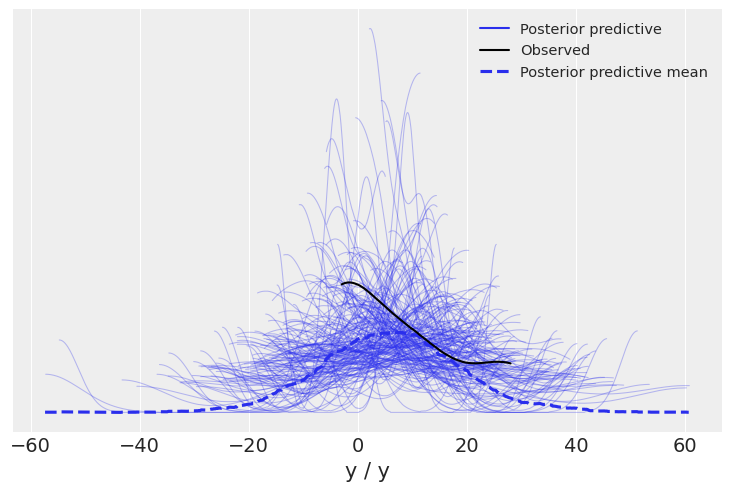
This last version, which contains both observed data and posterior predictive can be used to plot posterior predictive checks:
az.plot_ppc(idata4, var_names=["y"], alpha=0.3, num_pp_samples=200);
%load_ext watermark
%watermark -n -u -v -iv -w
Last updated: Mon Aug 30 2021

Python implementation: CPython
Python version       : 3.8.6
IPython version      : 7.27.0

emcee: 3.1.1
arviz: 0.11.2
numpy: None

Watermark: 2.1.0