Ctrl+K
Logo image
dev

Site Navigation

  • Getting Started
  • Example Gallery
  • User Guide
  • API Reference
  • Community
  • Contributing
  • About

Site Navigation

  • Getting Started
  • Example Gallery
  • User Guide
  • API Reference
  • Community
  • Contributing
  • About

Section Navigation

Mixed Plots

  • Forest Plot with ESS
  • Traceplot
  • Rank Bars Diagnostic with KDE
  • Traceplot with Circular Variables
  • Traceplot rank_vlines

Distributions

  • Density Plot
  • Dist Plot
  • Dot Plot
  • ECDF Plot
  • Forest Plot
  • Ridgeplot
  • Joint Plot
  • KDE Plot
  • 2D KDE
  • 2D KDE with HDI Contours
  • KDE quantiles
  • Hexbin PairPlot
  • KDE Pair Plot
  • KDE Pair Plot with HDI Contours
  • Point Estimate Pairplot
  • Posterior Plot
  • Posterior Plot (reducing school dimension)
  • Violin plot

Distribution Comparison

  • Density Plot (Comparison)
  • Forest Plot Comparison
  • Single-Sided Violin Plot

Inference Diagnostics

  • Autocorrelation Plot
  • Energy Plot
  • ESS Evolution Plot
  • ESS Local Plot
  • ESS Quantile Plot
  • Quantile Monte Carlo Standard Error Plot
  • Quantile MCSE Errobar Plot
  • Pair Plot
  • Parallel Plot
  • Rank plot

Regression or Time Series

  • Plot HDI
  • Regression Plot

Model Comparison

  • Bayes Factor Plot
  • Compare Plot
  • ELPD Plot
  • Pareto Shape Plot

Model Checking

  • Bayesian u-value Plot
  • Bayesian p-value with T statistic Plot
  • LOO-PIT ECDF Plot
  • LOO-PIT Overlay Plot
  • Posterior Predictive Check Plot
  • Posterior Predictive Check Cumulative Plot
  • Separation Plot

Styles

  • Matplotlib styles
  • Example gallery
  • Bayesian u-value Plot

Bayesian u-value Plot#

See also

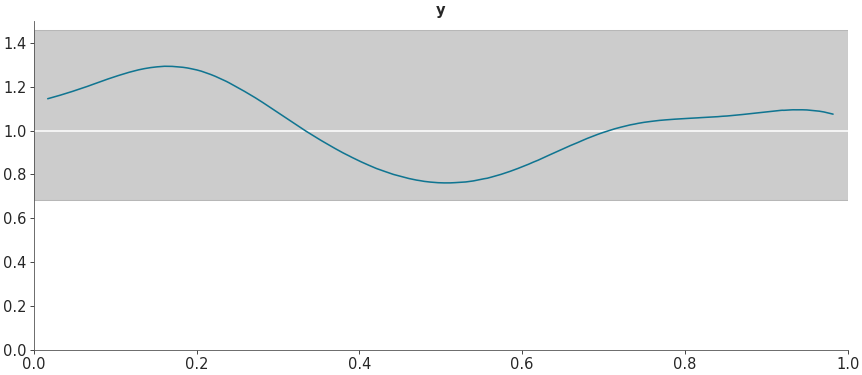
API Documentation: plot_bpv()

../_images/mpl_plot_bpv.png
import matplotlib.pyplot as plt

import arviz as az

az.style.use("arviz-doc")

data = az.load_arviz_data("regression1d")
az.plot_bpv(data)

plt.show()

Download Python Source Code: matplotlib/mpl_plot_bpv.py

import arviz as az

data = az.load_arviz_data("regression1d")
ax = az.plot_bpv(data, backend="bokeh")

Download Python Source Code: bokeh/bokeh_plot_bpv.py

previous

Pareto Shape Plot

next

Bayesian p-value with T statistic Plot

Edit on GitHub
Show Source
Support ArviZ

© Copyright 2018, ArviZ devs.

Created using Sphinx 5.3.0.

Built with the PyData Sphinx Theme 0.13.1.