Posterior Plot#
See also
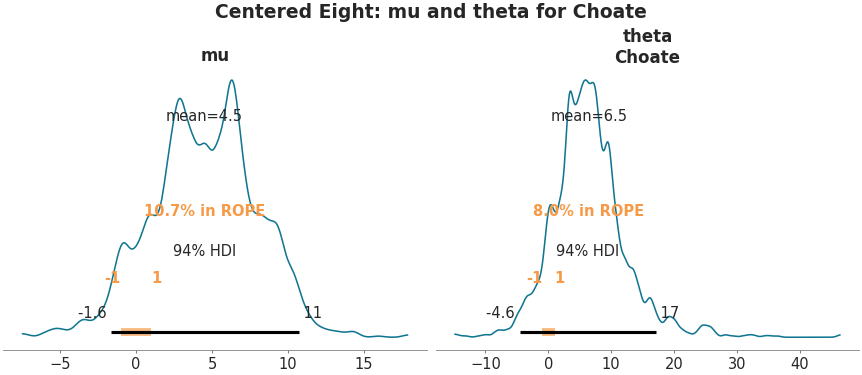
API Documentation: plot_posterior()
import matplotlib.pyplot as plt

import arviz as az

az.style.use("arviz-doc")

data = az.load_arviz_data("centered_eight")

coords = {"school": ["Choate"]}
axes = az.plot_posterior(
    data,
    var_names=["mu", "theta"],
    coords=coords,
    rope=(-1, 1),
    figsize=(11.5, 5),
)

fig = axes.flatten()[0].get_figure()
fig.suptitle("Centered Eight: mu and theta for Choate")

plt.show()
import arviz as az

data = az.load_arviz_data("centered_eight")

coords = {"school": ["Choate"]}
ax = az.plot_posterior(
    data, var_names=["mu", "theta"], coords=coords, rope=(-1, 1), backend="bokeh"
)