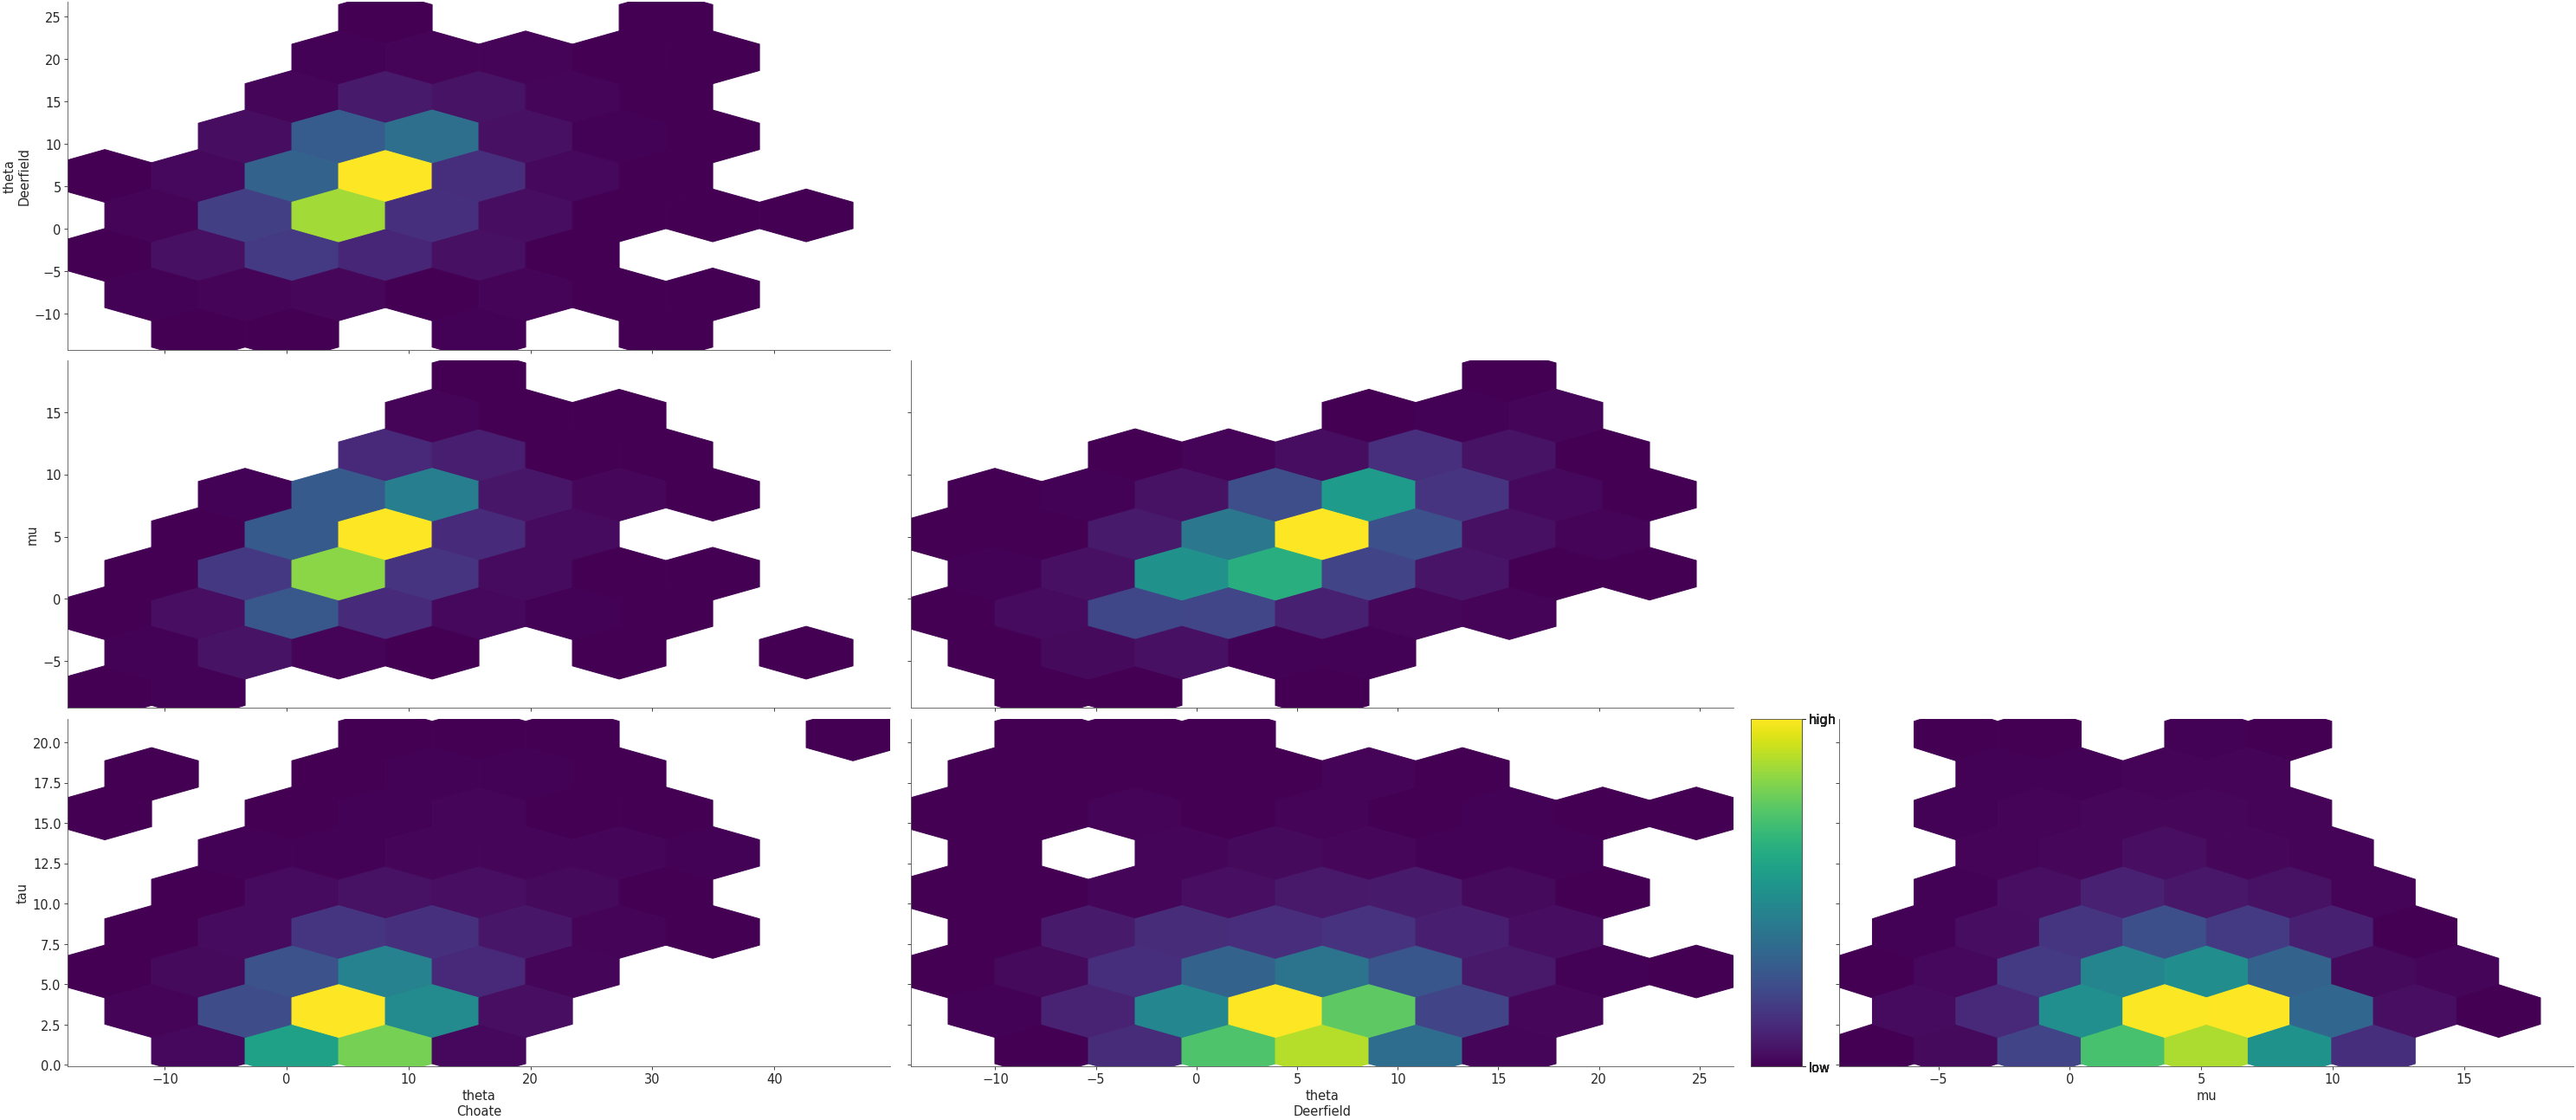
Hexbin PairPlot#
See also
API Documentation: plot_pair()
import matplotlib.pyplot as plt

import arviz as az

az.style.use("arviz-doc")

centered = az.load_arviz_data("centered_eight")

coords = {"school": ["Choate", "Deerfield"]}
az.plot_pair(
    centered,
    var_names=["theta", "mu", "tau"],
    kind="hexbin",
    coords=coords,
    colorbar=True,
)
plt.show()
import arviz as az

centered = az.load_arviz_data("centered_eight")

coords = {"school": ["Choate", "Deerfield"]}
ax = az.plot_pair(
    centered,
    var_names=["theta", "mu", "tau"],
    kind="hexbin",
    coords=coords,
    colorbar=True,
    divergences=True,
    backend="bokeh",
)