arviz.plot_mcse#
- arviz.plot_mcse(idata, var_names=None, filter_vars=None, coords=None, errorbar=False, grid=None, figsize=None, textsize=None, extra_methods=False, rug=False, rug_kind='diverging', n_points=20, labeller=None, ax=None, rug_kwargs=None, extra_kwargs=None, text_kwargs=None, backend=None, backend_kwargs=None, show=None, **kwargs)[source]#
Plot quantile or local Monte Carlo Standard Error.
- Parameters
- idata: obj
Any object that can be converted to an
arviz.InferenceDataobject Refer to documentation ofarviz.convert_to_dataset()for details- var_names: list of variable names, optional
Variables to be plotted. Prefix the variables by
~when you want to exclude them from the plot.- filter_vars: {None, “like”, “regex”}, optional, default=None
If
None(default), interpret var_names as the real variables names. If “like”, interpret var_names as substrings of the real variables names. If “regex”, interpret var_names as regular expressions on the real variables names. A lapandas.filter.- coords: dict, optional
Coordinates of var_names to be plotted. Passed to
xarray.Dataset.sel()- errorbar: bool, optional
Plot quantile value +/- mcse instead of plotting mcse.
- gridtuple
Number of rows and columns. Defaults to None, the rows and columns are automatically inferred.
- figsize: tuple, optional
Figure size. If None it will be defined automatically.
- textsize: float, optional
Text size scaling factor for labels, titles and lines. If None it will be autoscaled based on figsize.
- extra_methods: bool, optional
Plot mean and sd MCSE as horizontal lines. Only taken into account when
errorbar=False.- rug: bool
Plot rug plot of values diverging or that reached the max tree depth.
- rug_kind: bool
Variable in sample stats to use as rug mask. Must be a boolean variable.
- n_points: int
Number of points for which to plot their quantile/local ess or number of subsets in the evolution plot.
- labellerlabeller instance, optional
Class providing the method
make_label_vertto generate the labels in the plot titles. Read the Label guide for more details and usage examples.- ax: numpy array-like of matplotlib axes or bokeh figures, optional
A 2D array of locations into which to plot the densities. If not supplied, Arviz will create its own array of plot areas (and return it).
- rug_kwargs: dict
kwargs passed to rug plot in
matplotlib.axes.Axes.plot()orbokeh.models.glyphs.Scatter.- extra_kwargs: dict, optional
kwargs passed as extra method lines in
matplotlib.axes.Axes.axhline()orbokeh.models.Span- text_kwargs: dict, optional
kwargs passed to
matplotlib.axes.Axes.annotate()for extra methods lines labels. It accepts the additional keyxto setxy=(text_kwargs["x"], mcse). text_kwargs are ignored for the bokeh plotting backend.- backend: str, optional
Select plotting backend {“matplotlib”,”bokeh”}. Default “matplotlib”.
- backend_kwargs: bool, optional
These are kwargs specific to the backend being passed to
matplotlib.pyplot.subplots()orbokeh.plotting.figure().- show: bool, optional
Call backend show function.
- **kwargs
Passed as-is to
matplotlib.axes.Axes.hist()ormatplotlib.axes.Axes.plot()in matplotlib depending on the value ofkind.
- Returns
- axes: matplotlib axes or bokeh figures
See also
arviz.mcse()Calculate Markov Chain Standard Error statistic.
References
Vehtari et al. (2019) see https://arxiv.org/abs/1903.08008
Examples
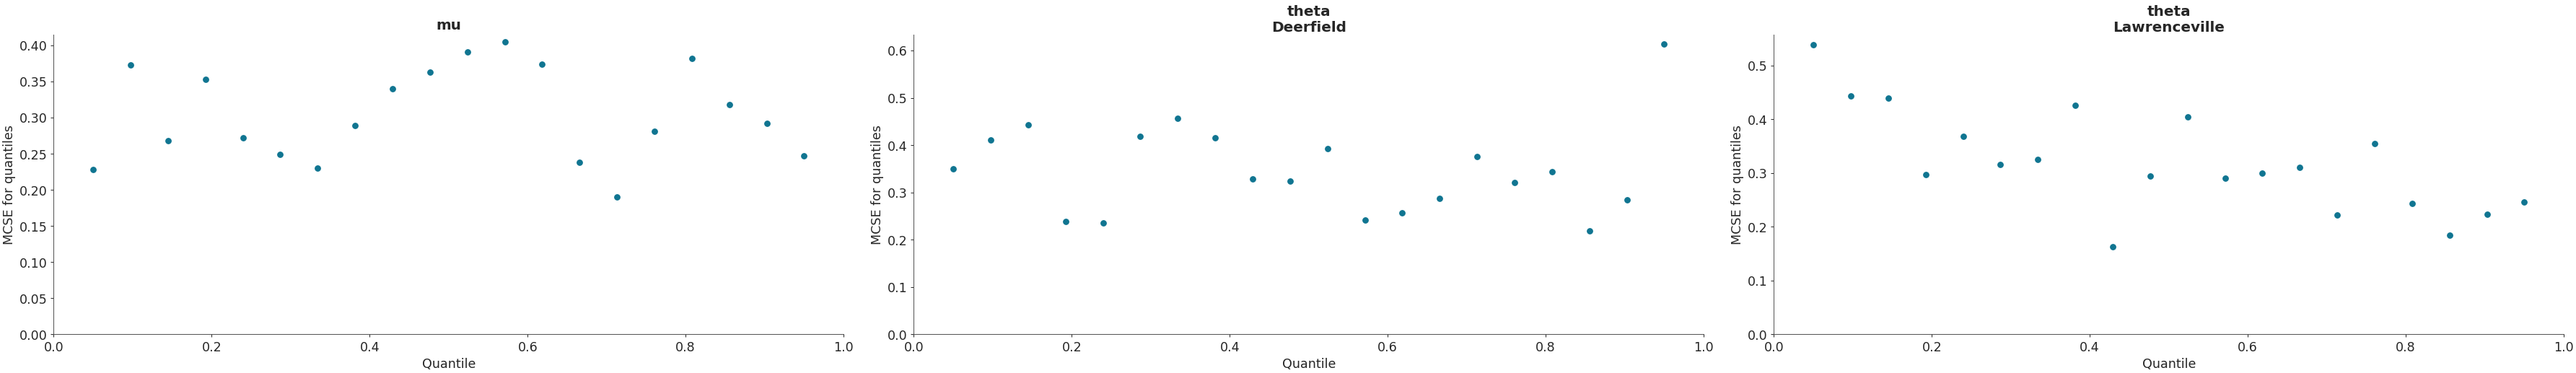
Plot quantile Monte Carlo Standard Error.
>>> import arviz as az
>>> idata = az.load_arviz_data("centered_eight")
>>> coords = {"school": ["Deerfield", "Lawrenceville"]}
>>> az.plot_mcse(
...     idata, var_names=["mu", "theta"], coords=coords
... )