arviz.plot_compare#
- arviz.plot_compare(comp_df, insample_dev=False, plot_standard_error=True, plot_ic_diff=True, order_by_rank=True, legend=True, title=True, figsize=None, textsize=None, labeller=None, plot_kwargs=None, ax=None, backend=None, backend_kwargs=None, show=None)[source]#
Summary plot for model comparison.
Models are compared based on their expected log pointwise predictive density (ELPD), the ELPD is estimated either by Pareto smoothed importance sampling leave-one-out cross-validation (LOO) or using the widely applicable information criterion (WAIC). We recommend LOO in line with the work presented by Vehtari et al. (2016) available here: https://arxiv.org/abs/1507.04544.
This plot is in the style of the one used in the book Statistical Rethinking by Richard McElreath.Chapter 6 in the first edition or 7 in the second.
- Parameters
- comp_dfpd.DataFrame
Result of the
arviz.compare()method- insample_devbool, optional
Plot in-sample ELPD, that is the value of the information criteria without the penalization given by the effective number of parameters (p_loo or p_waic). Defaults to False
- plot_standard_errorbool, optional
Plot the standard error of the ELPD. Defaults to True
- plot_ic_diffbool, optional
Plot standard error of the difference in ELPD between each model and the top-ranked model. Defaults to True
- order_by_rankbool
If True (default) ensure the best model is used as reference.
- legendbool
Add legend to figure. By default True.
- figsizetuple, optional
If None, size is (6, num of models) inches
- titlebool:
Show a tittle with a description of how to interpret the plot. Defaults to True.
- textsize: float
Text size scaling factor for labels, titles and lines. If None it will be autoscaled based on
figsize.- labellerlabeller instance, optional
Class providing the method
model_name_to_strto generate the labels in the plot. Read the Label guide for more details and usage examples.- plot_kwargsdict, optional
Optional arguments for plot elements. Currently accepts ‘color_ic’, ‘marker_ic’, ‘color_insample_dev’, ‘marker_insample_dev’, ‘color_dse’, ‘marker_dse’, ‘ls_min_ic’ ‘color_ls_min_ic’, ‘fontsize’
- ax: axes, optional
Matplotlib axes or bokeh figures.
- backend: str, optional
Select plotting backend {“matplotlib”,”bokeh”}. Default “matplotlib”.
- backend_kwargs: bool, optional
These are kwargs specific to the backend being used, passed to
matplotlib.pyplot.subplots()orbokeh.plotting.figure().- showbool, optional
Call backend show function.
- Returns
- axesmatplotlib axes or bokeh figures
See also
Examples
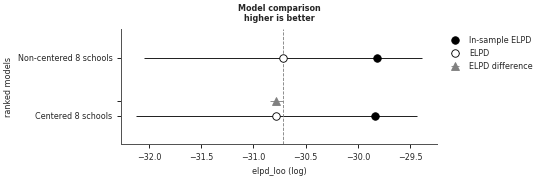
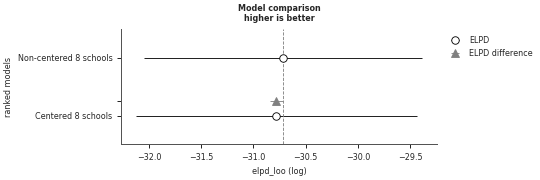
Show default compare plot
>>> import arviz as az
>>> model_compare = az.compare({'Centered 8 schools': az.load_arviz_data('centered_eight'),
>>>                  'Non-centered 8 schools': az.load_arviz_data('non_centered_eight')})
>>> az.plot_compare(model_compare)
Include the in-sample ELDP
>>> az.plot_compare(model_compare, insample_dev=True)